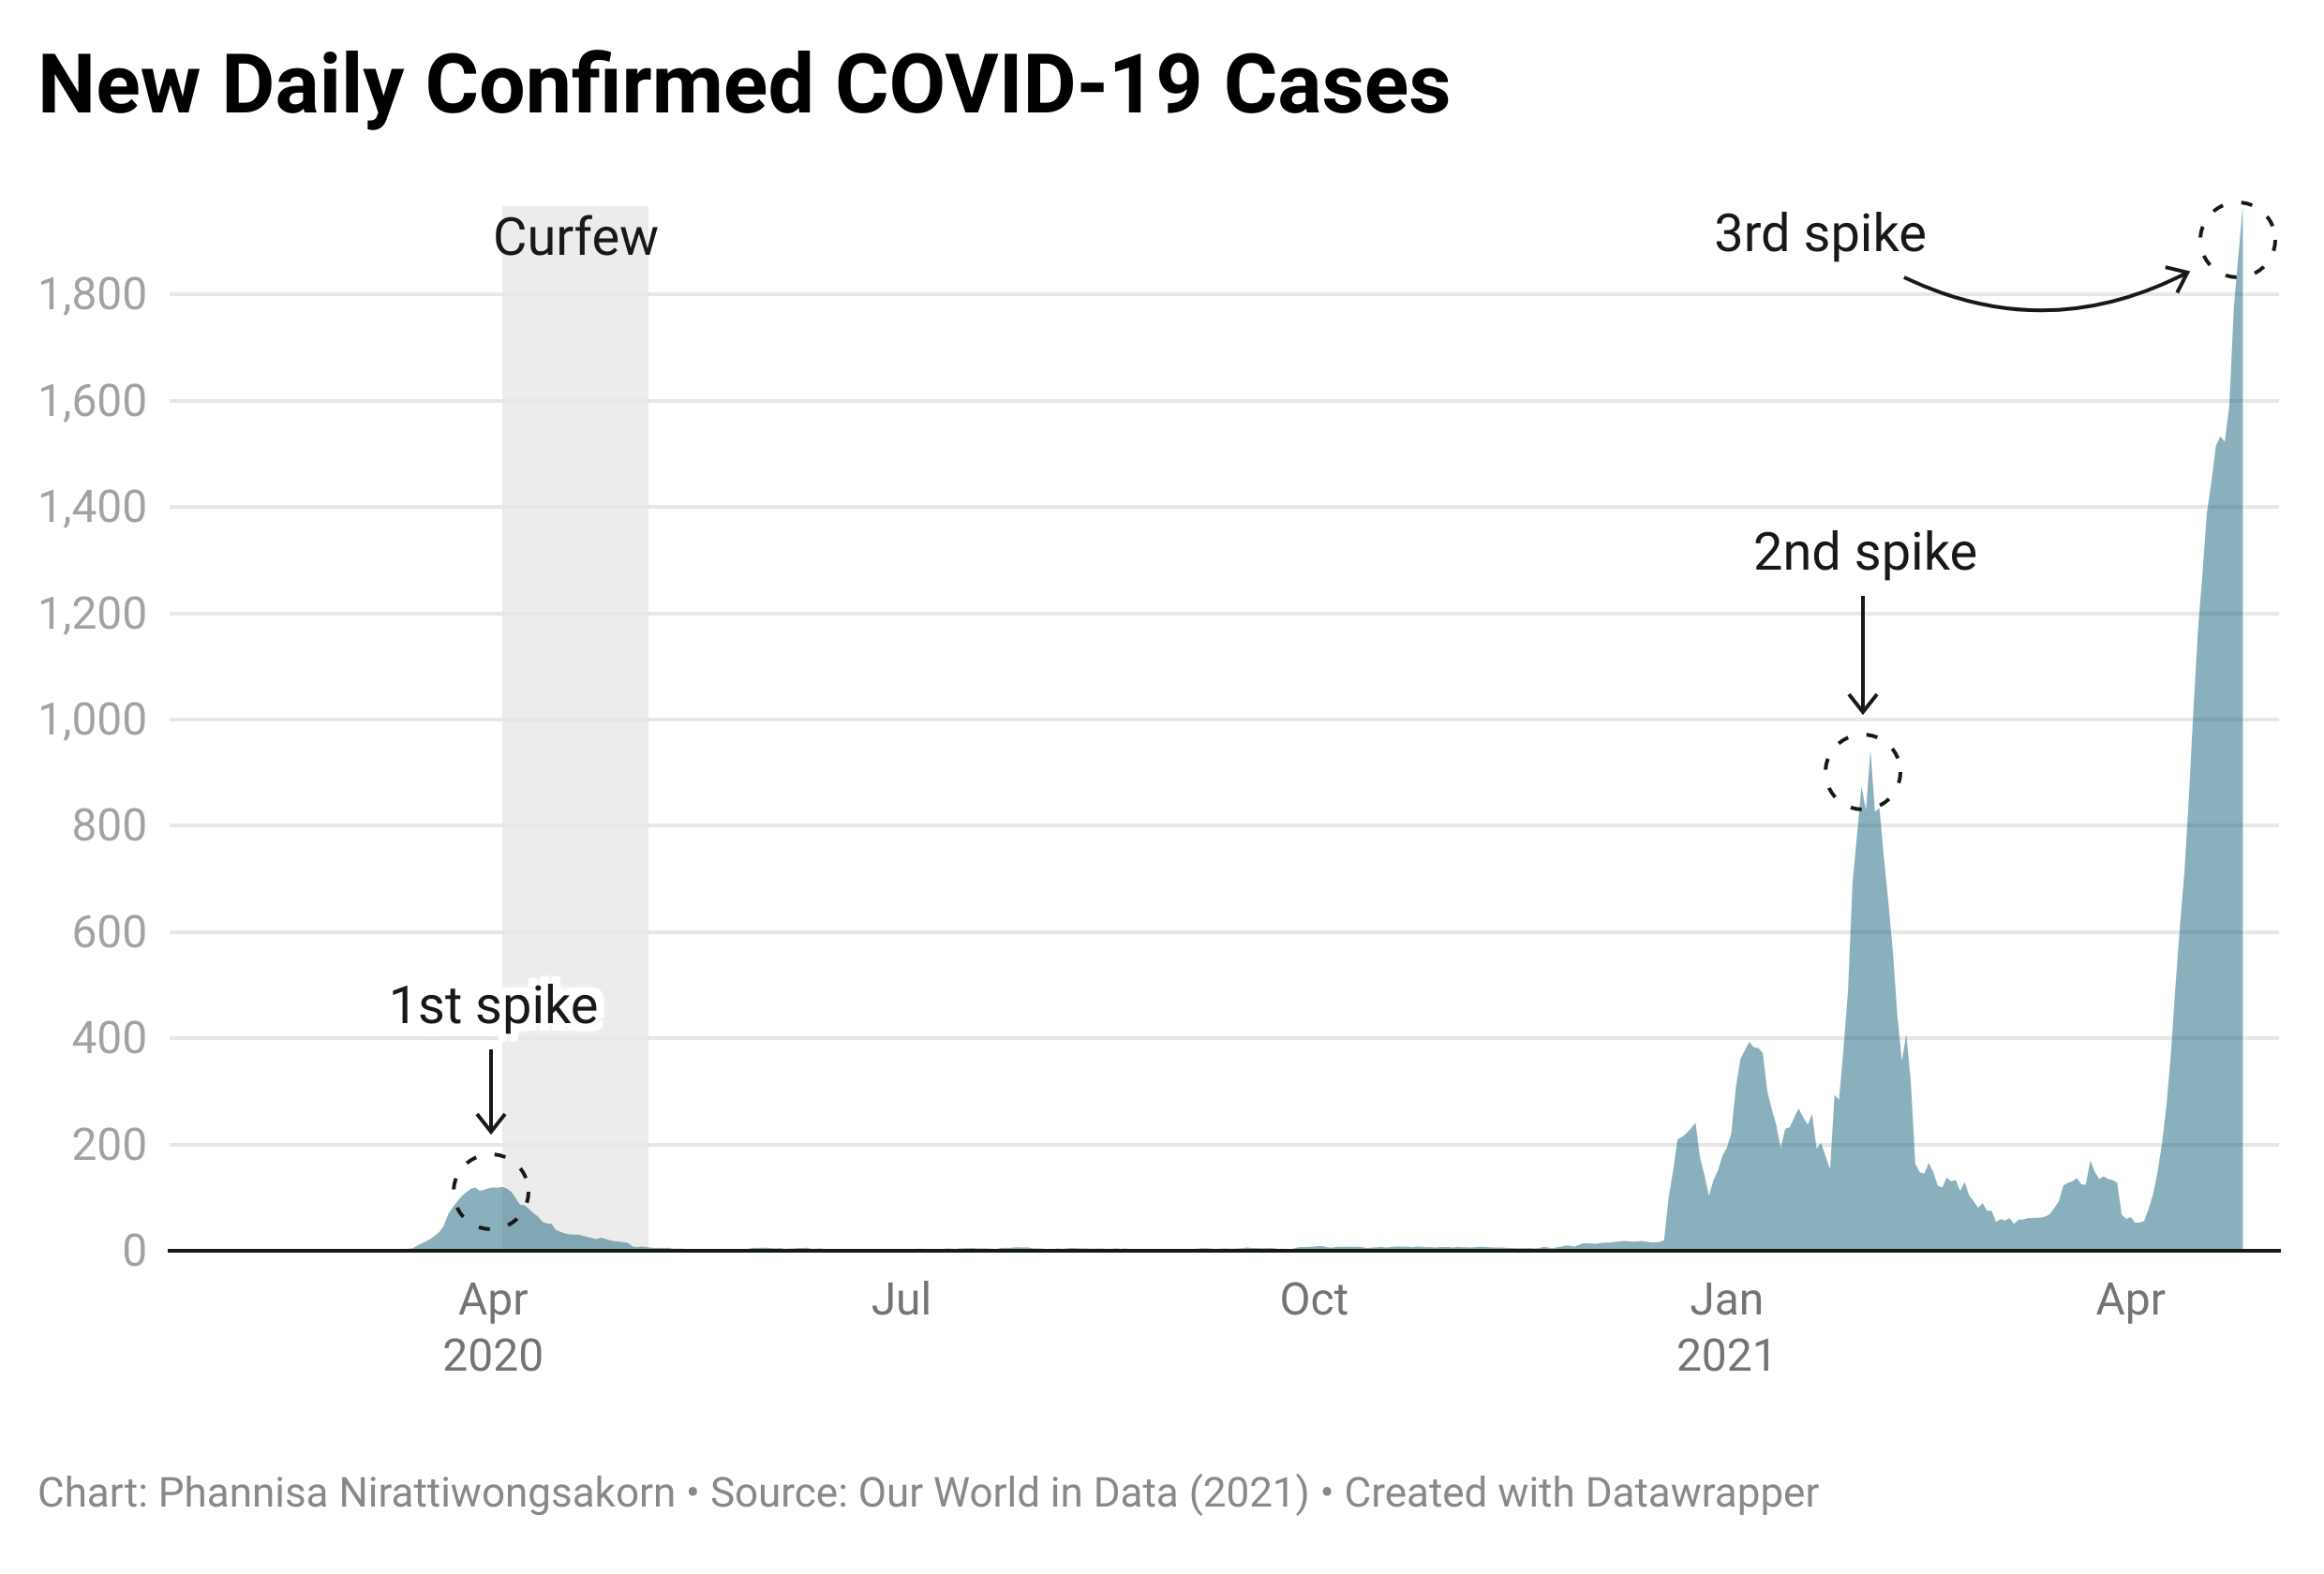
Since December 2019, Thailand has faced at least 3 COVID spikes – April 2020 (peaked at 120 new cases/day), February 2021 (peaked at 943 new cases/day), and current April 2021 (peak 1,966 new cases/day and increasing). 2 of 3 spikes are peaked during March – April, with one major difference: curfew measurement was applied in April 2020. The fact leads to this article’s goal: comparing people’s different reactions to COVID-19 spikes in different years of 2020 – 2021. A set of visualizations will show differences in people’s mobility in 2020 (with curfew) and 2021 (without curfew). The implication shall help to measure the efficiency of curfew to limit mobility and infection among citizens.
Data source: Google’s Community Mobility Report (2021), Apple’s COVID‑19 – Mobility Trends Reports (2021), Our World in Data (2021)
How to read graphs: the same tone of colors are used to visualize trends of 2 years. Darker color represents newer year. For example, trends of mobility in workplace is visualized in red tone. 2020 is represented by pink while 20201 is represented by red, the darker color.
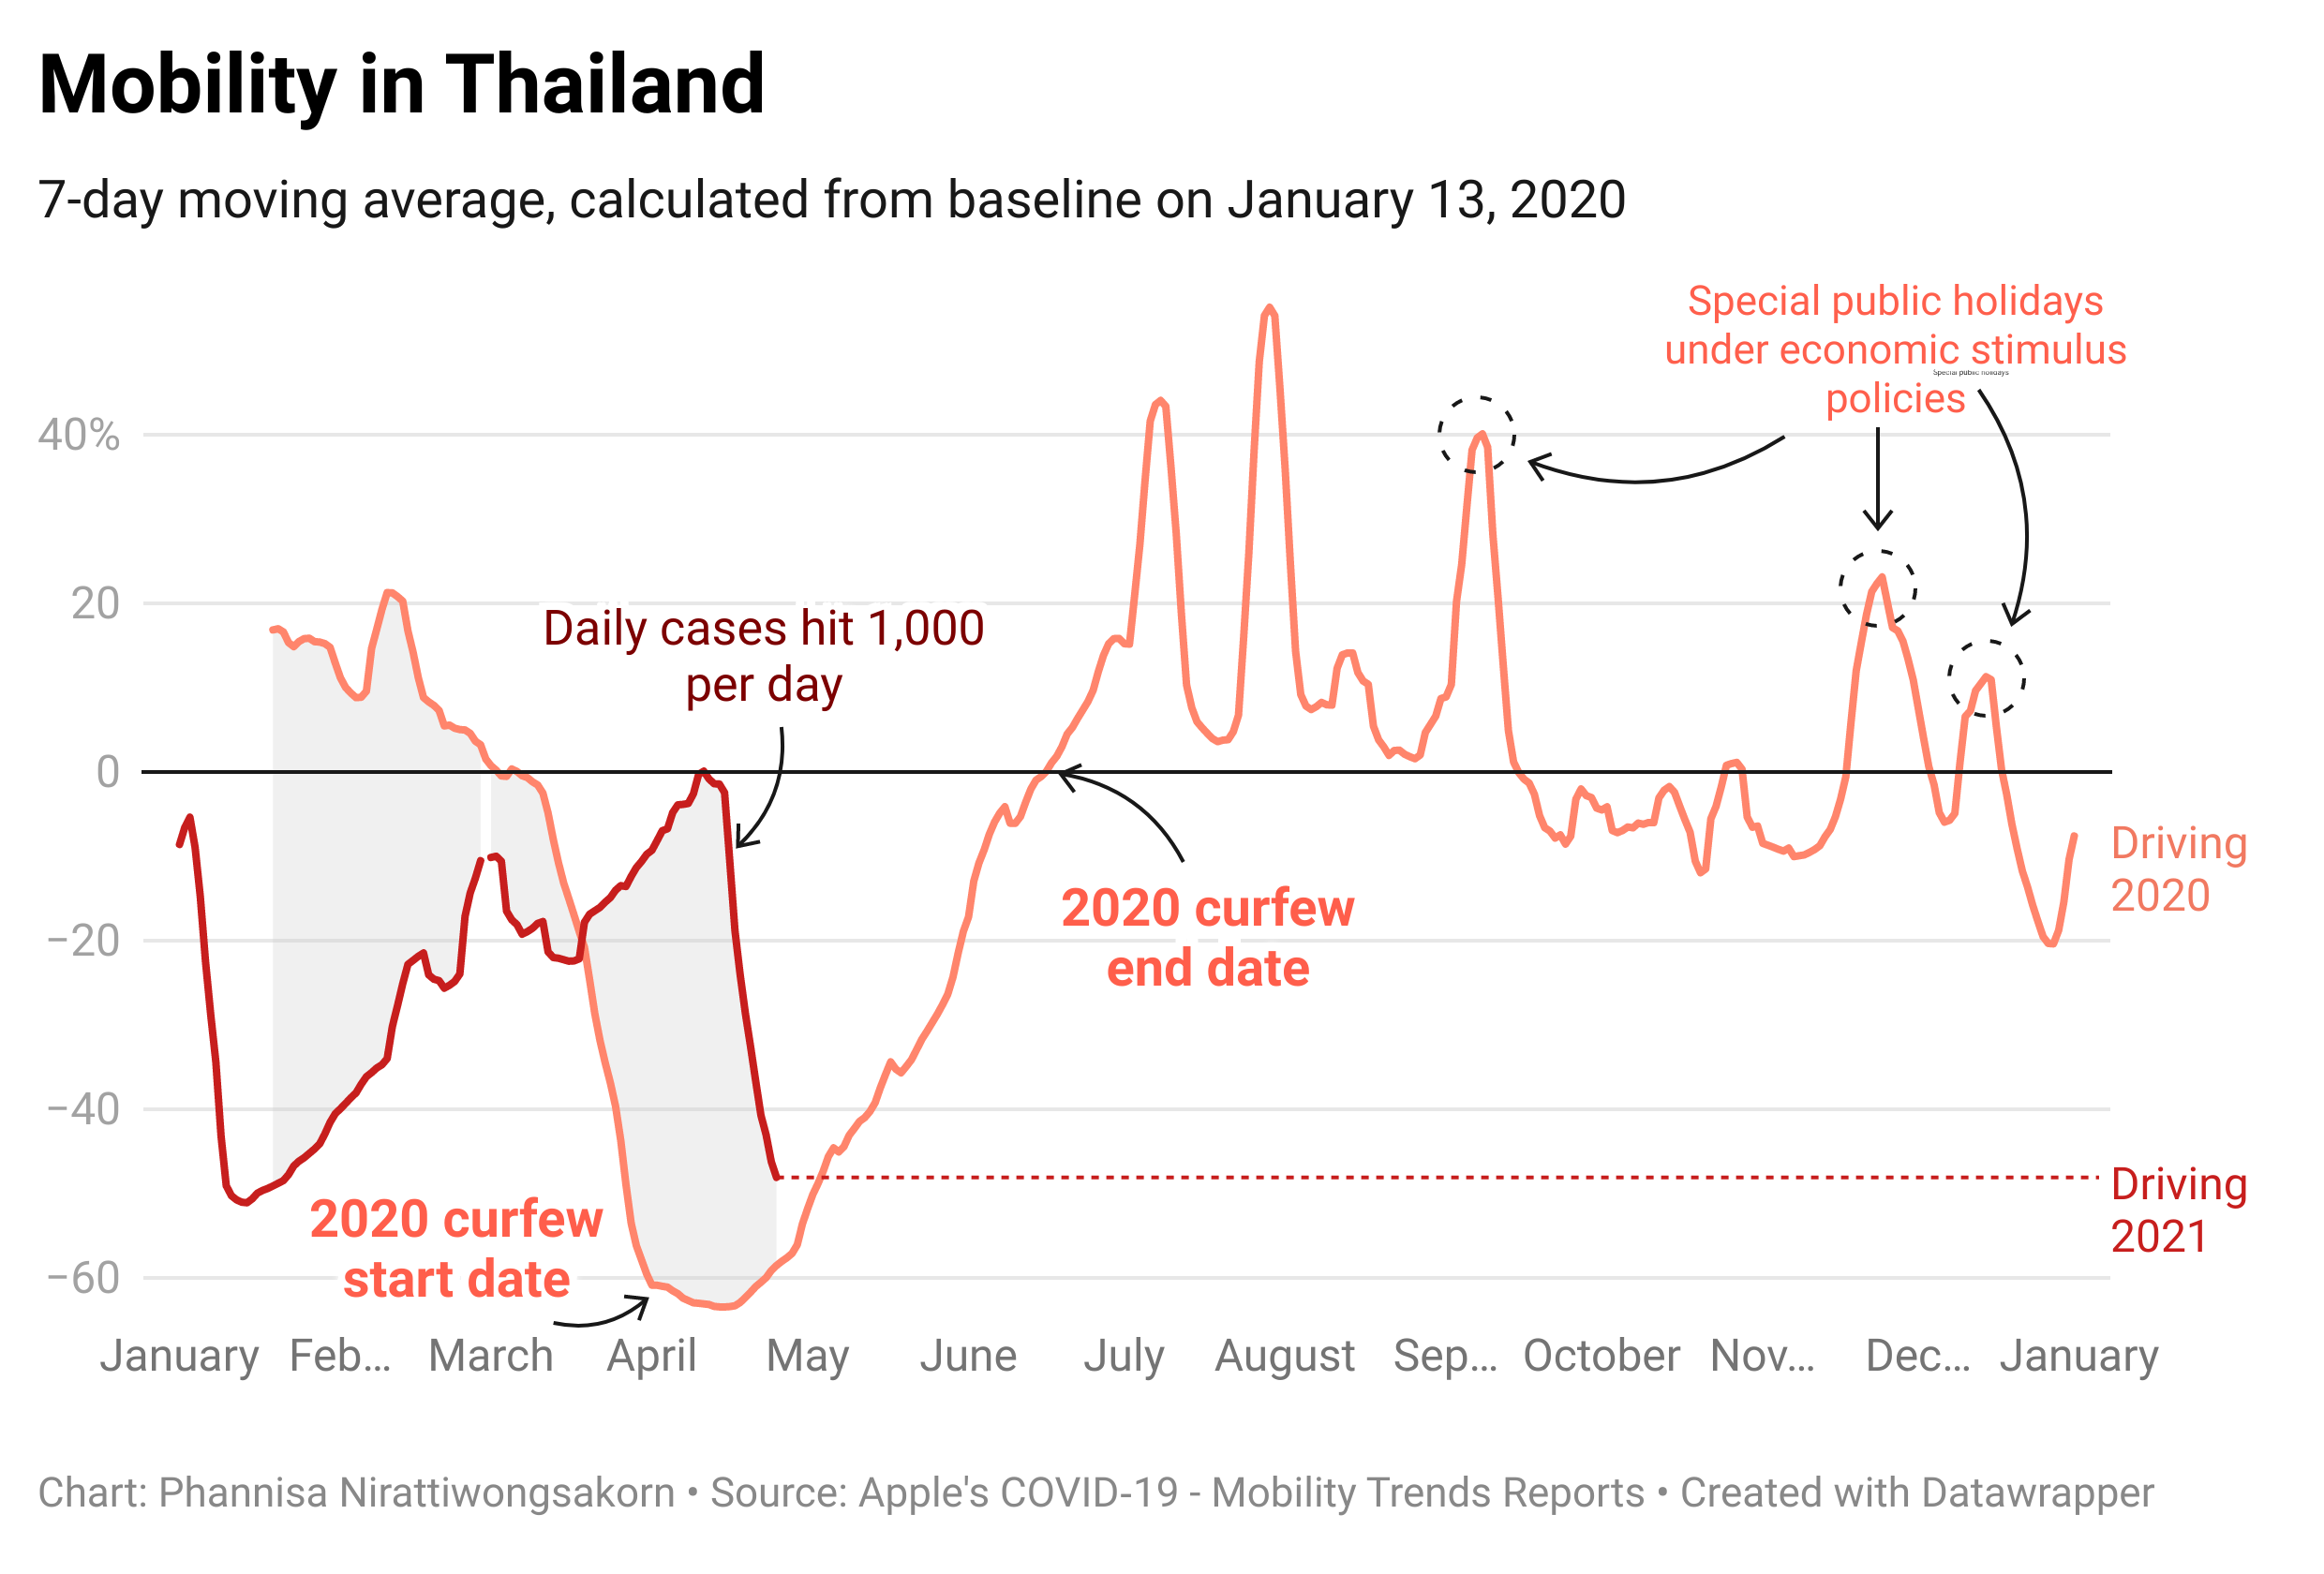
Overall Mobility
Overall mobility in Thailand had declined before the curfew date on April 3, 2020. However, mobility had increased after the curfew ended on June 15, 2020. After the curfew, there were at least 3 mobility spikes according to 3 special public holidays in September, November, and December. The holidays were compensated for Songkran festival between April 13 – 15 that had been canceled to stimulate deprived economic activities.
Looking into Different Types of Locations
When looking into different types of locations namely residential, workplaces, and retail and recreation areas, parks, and transit stations there are different patterns in mobility changes that are interesting.
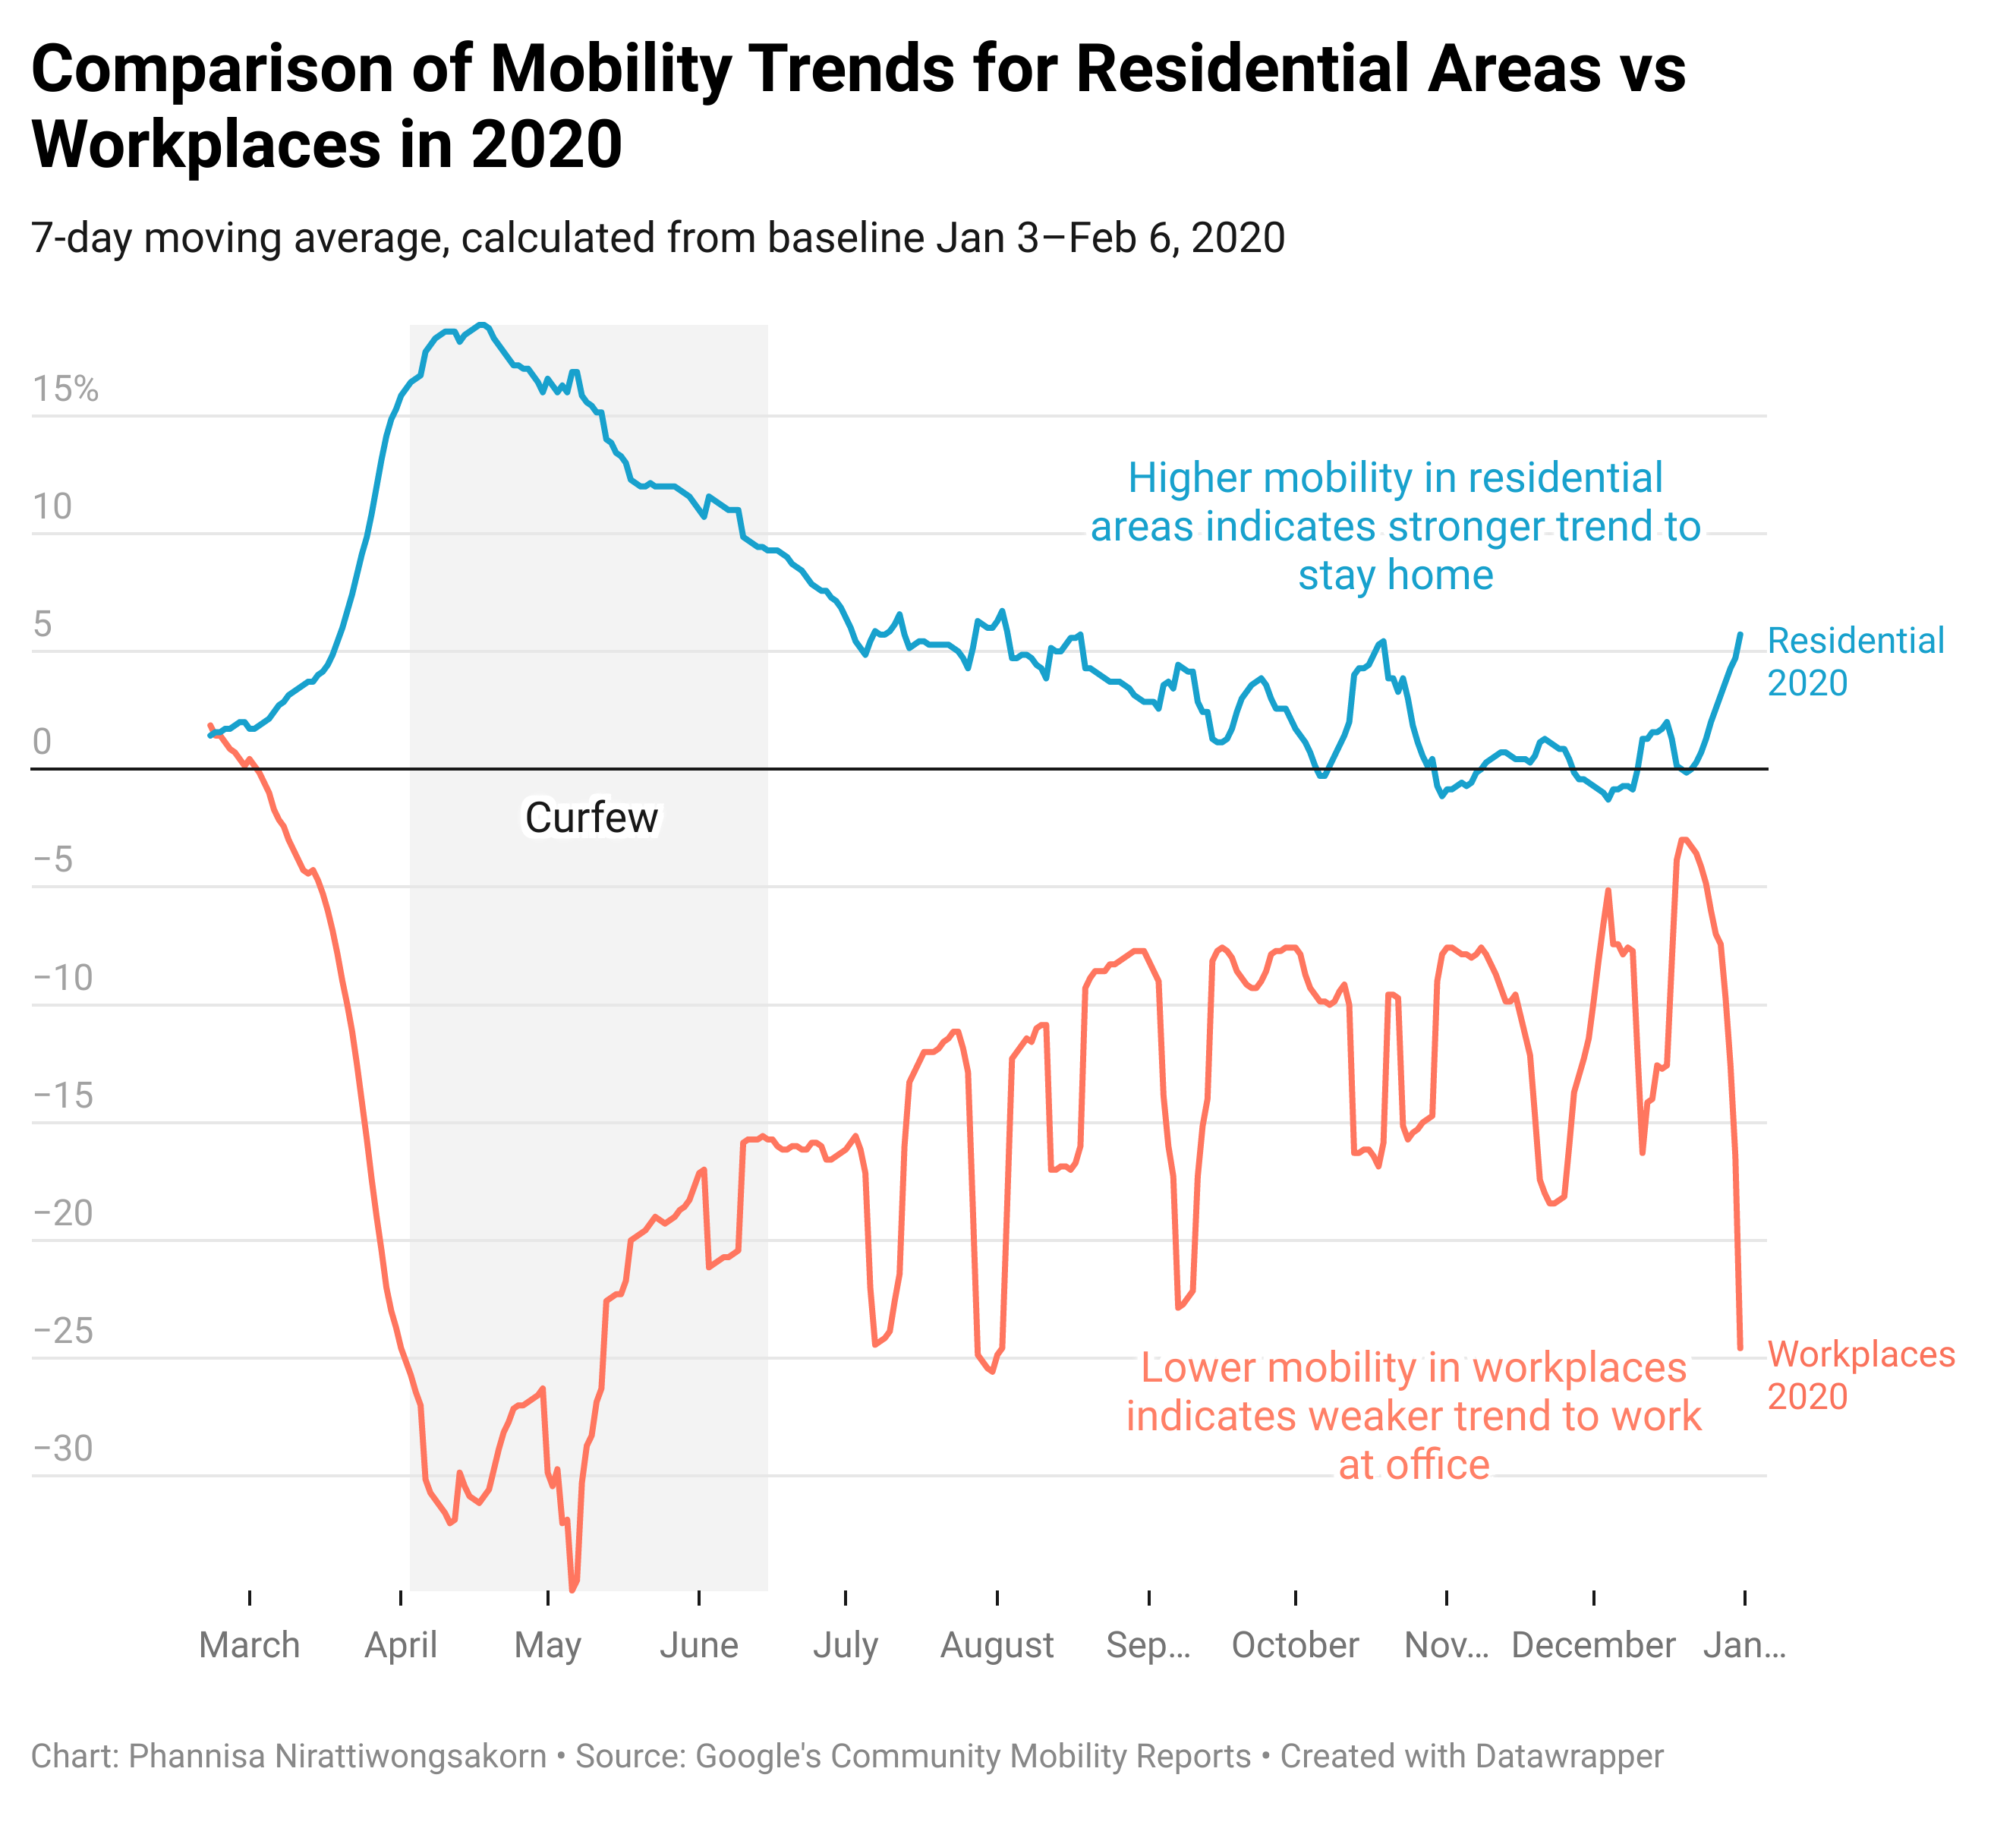
Residential Areas
Higher mobility in residential areas means higher chance of people to stay home. From the graph, mobility in residential areas increases in accordance with number of new daily confirmed cases. People stayed at home 20% higher than baseline during the curfew period.

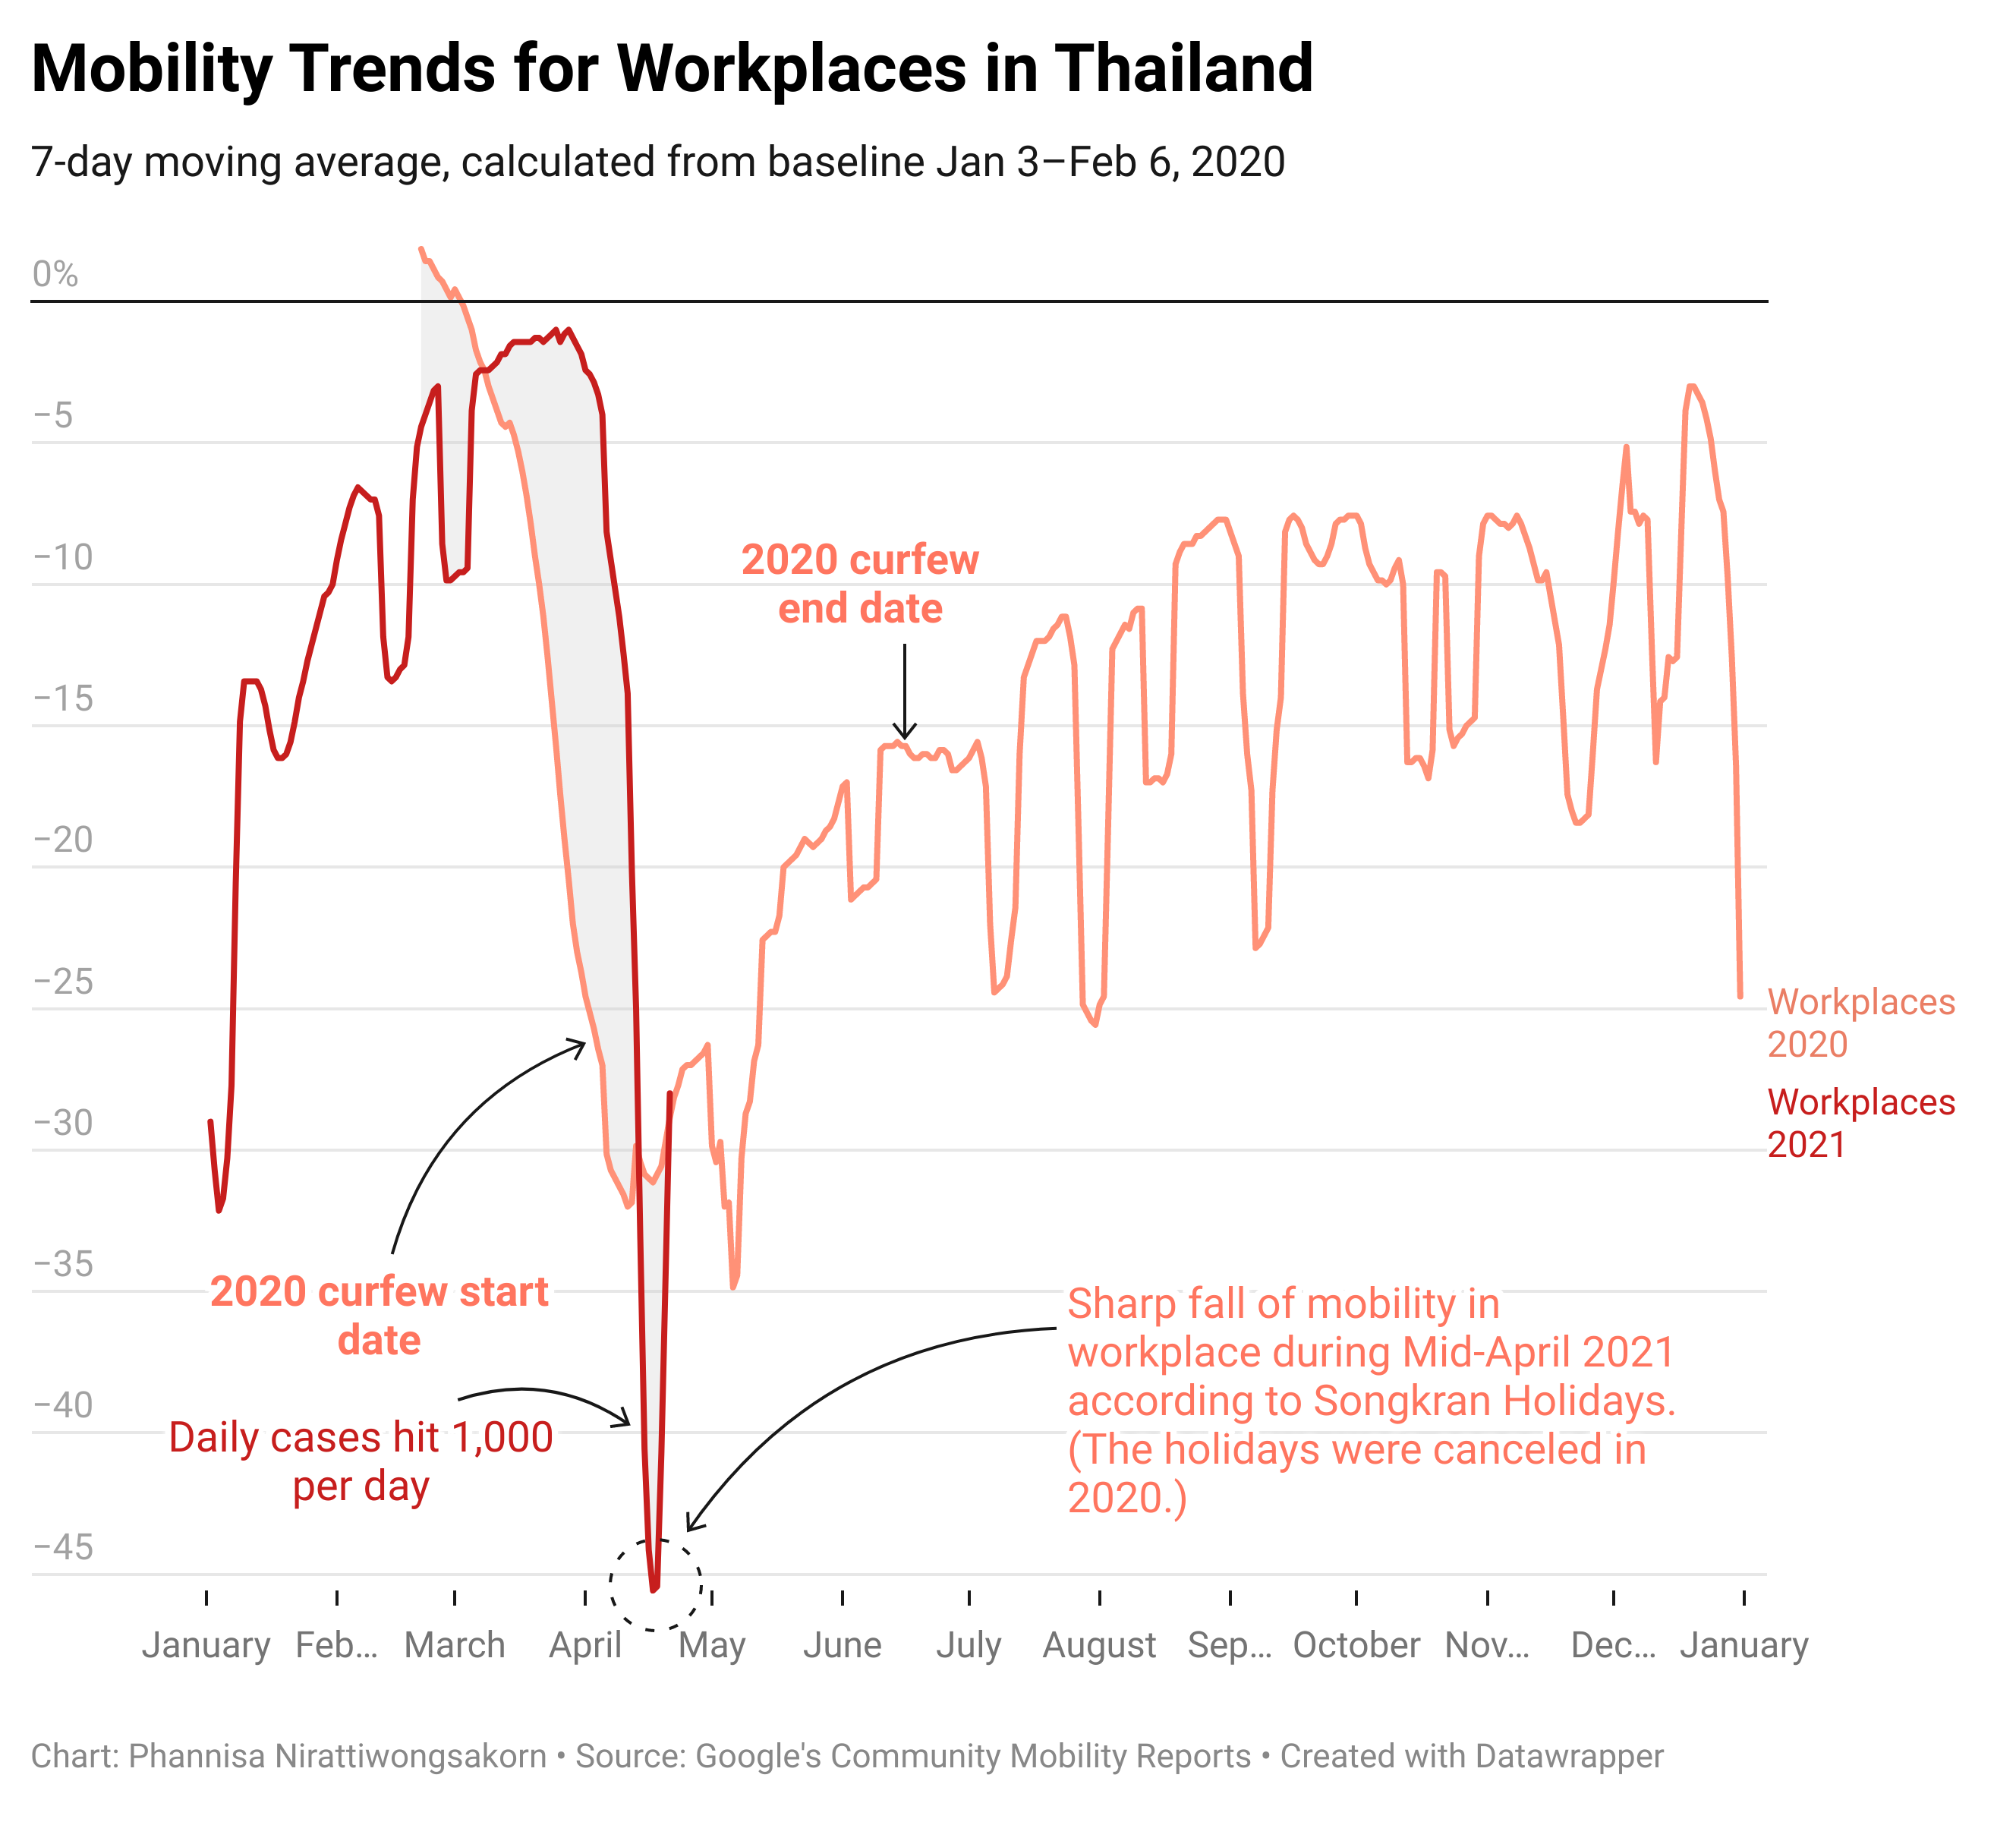
Workplaces
Workplaces are less affected by curfew measurement but more affected by COVID-19 in the bigger picture. Less people has come to work at offices since mid-March, 2020, 14% less in 2020 and 11% less in 2021. There has been no time that mobility in workplaces is higher than baseline. Trend to Work from Home may continue even COVID ends.
Another interesting trend is difference between mobility decreases in April 2020 and 2021. Songkran festival, the most important public holidays in Thailand between April 23 – 15, has been canceled in 2020 to control spread of the disease. Meanwhile, the holidays were not canceled in 2021. Different measurement led to almost 15% difference of commuting to workplace between the 2 years, 30% less mobility in 2020 and 45% less mobility in 2021.
Retails and Recreation Areas
Retails and recreation areas, hereby after called ‘retails’, include restaurants, cafes, shopping centers, theme parks, museums, libraries, and movie theaters. They have been affected by COVID-19 during 2020 all year. In 2020, mobility in retails’ plummeted during mid-April or Songkran festival when retails were supposed to be most crowded. Retails’ activities were back to higher than baseline in February and March, a little earlier than the ongoing COVID spike.

Parks
Parks are areas where mobility is the most affected by COVID-19. Mobility in park areas dropped lowest during mid-April, 2020, less than a half from the baseline. On average, parks are 21.7% less visited in 2020. The trend may indicate that parks are less necessary destinations among Thais. However, it has to be taken into consideration that most parked are publicly-owned. Even curfew is not applied, all level of governments may apply measurement to close public spaces including parks to control spread of the disease. Thus, parks tend to be closed by government first.

Transit Stations
Transit stations include subway, bus, and train stations. Mobility in transit stations are most affected by COVID among all types of areas, in both terms of average and the lowest point. On average, there were 30.96% less mobility in transit stations in 2020. At the lowest point during mid-April, these locations were 66% less visited. In accordance with mobility in workplaces, there has been no time that mobility in transits is higher than baseline. The trend may indicate hesitance to use public transportation as it gives higher exposure to contact with other people.
Bottom Line
Comparing mobility trends between 2020 and 2021 visualizes impacts of COVID on different aspects. The impacts may have shorter effects such as mobility bounce after the end of curfew, or longer effect such as long-term decrease in commuting to workplaces. Especially when looking into each type of locations, same constraint or measurement may have different impacts and levels of impacts on different types of locations.
However, it is still in early stage of comparison as today is still in the first half of 2021. Looking at these trends again at the end of the year may give clearer pictures of COVID impacts which can be applied to urban planning and urban design to better public spaces.