My work at Urban Development Strategy Division (UDSD), Office of the National Economic and Social Development Council (NESDC) to report progress of SDG 11 Targets and Indicators for Thailand’s SDG Progress Report: 2016 – 2020 which will be published in September 2020 and how it is related to the ‘SET ZERO’ event.
Thai SDG and the ‘SET ZERO’ Event
Changes in SDG implementation have been made in the Sustainable Development Committee’s meeting 1/B.E.2562 (การประชุมคณะกรรมการเพื่อการพัฒนาที่ยั่งยืน (กพย.) ครั้งที่ 1/2562) on December 19, 2019. The restructures of government executives and NESDC caused gaps in SDG implementation. Thus, ‘SET ZERO’ changes were made to close those gaps as following:
| Before ‘SET ZERO’ | After ‘SET ZERO’ |
|---|---|
| NESDC shall be responsible for SDG implementation plan | |
| Cancel all executions under SDG Subcommittee’s decisions and orders | |
| Restructure SDG Subcommittee on Monitoring and Evaluation | |
| The responsible agencies were obliged to report SDG progress every 6 months. | Cancel the progress report, eMENSCR shall be used as the monitoring platform |
| Translation Goal = เป้าหมาย Target = เป้าประสงค์ | Translation Goal = เป้าหมายหลัก Target = เป้าหมาย |
| Assigned government agencies responsible for SDG implementation | Assigned government agencies responsible for National Strategy implementation shall be responsible for SDG implementation either |
| National Statistical Office (NSO) was responsible for National SDG Indicators preparation | Canceled NSO’s duties on National SDG Indicators preparation |
In short, the duties of SDG progress monitoring and report have been centralized to NESDC, instead of the other assigned agencies as the pre-SET-ZERO era.
UDSD and SDG 11
Urban Development Strategy Division (UDSD) of the Office of Economic and Social Development Council of Thailand (NESDC) was responsible for Sustainable Development Goal 11 (SDG 11) Make cities and human settlements inclusive, safe, resilient and sustainable (เป้าหมายที่ 11 ทำให้เมืองและการตั้งถิ่นฐานของมนุษย์มีความครอบคลุม ปลอดภัย มีภูมิต้านทานและยั่งยืน) in Thailand’s SDG Progress Report: 2016 – 2020.
Reported Cities
80 urban areas in the 13 target provinces of the first development period (2018 – 2023) in Master Plan under National Strategy (B.E. 2561 – 2580) Volume 6 on Smart Livable Cities and Volume 9 on Special Economic Zones are reported:
- Bangkok (1 area): the whole province
- Nakhon Pathom (6 areas): เทศบาลเมืองไร่ขิง เทศบาลเมืองกระทุ่มล้ม เทศบาลเมืองนครปฐม เทศบาลเมืองสามควายเผือก เทศบาลเมืองสามพราน เทศบาลนครนครปฐม
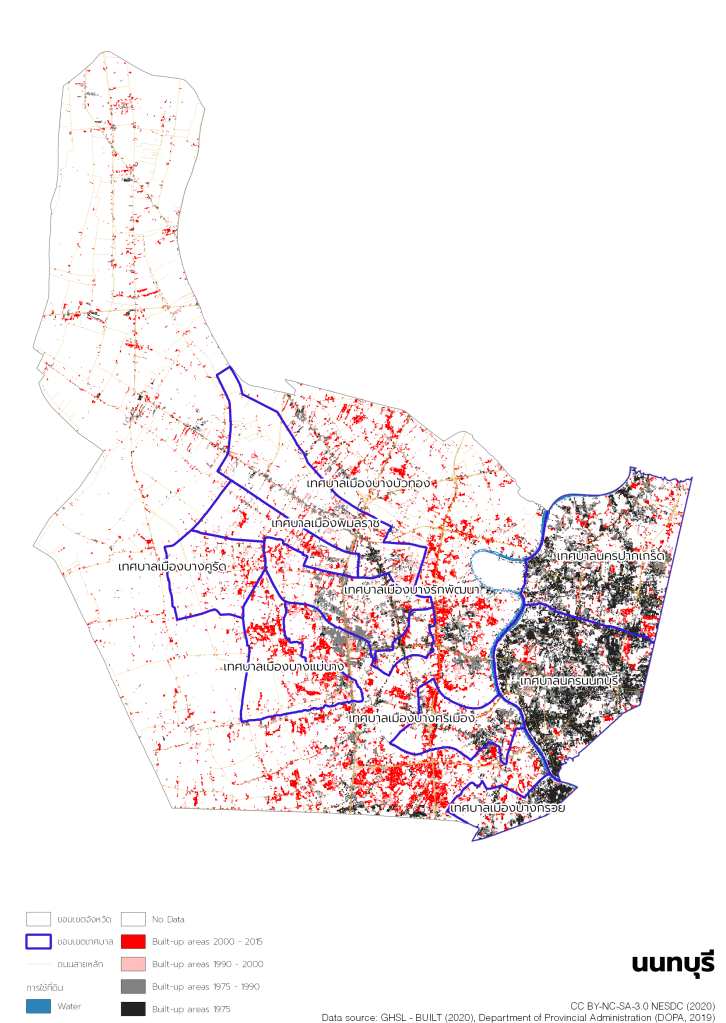
- Nonthaburi (9 areas): เทศบาลเมืองบางแม่นาง เทศบาลเมืองบางกรวย เทศบาลเมืองบางคูรัด เทศบาลเมืองบางบัวทอง เทศบาลเมืองบางรักพัฒนา เทศบาลเมืองบางศรีเมือง เทศบาลเมืองพิมลราช เทศบาลนครนนทบุรี เทศบาลนครปากเกร็ด
- Pathum Thani (9 areas): เทศบาลเมืองคลองหลวง เทศบาลเมืองคูคต เทศบาลเมืองท่าโขลง เทศบาลเมืองบางคูวัด เทศบาลเมืองบึงยี่โถ เทศบาลเมืองปทุมธานี เทศบาลเมืองลาดสวาย เทศบาลเมืองสนั่นรักษ์ เทศบาลนครรังสิต
- Samut Prakan (8 areas): เทศบาลเมืองแพรกษา เทศบาลเมืองแพรกษาใหม่ เทศบาลเมืองบางแก้ว เทศบาลเมืองปากน้ำสมุทรปราการ เทศบาลเมืองปู่เจ้าสมิงพราย เทศบาลเมืองพระประแดง เทศบาลเมืองลัดหลวง เทศบาลนครสมุทรปราการ
- Samut Sakhon (4 areas): เทศบาลเมืองกระทุ่มแบน เทศบาลเมืองคลองมะเดื่อ เทศบาลนครสมุทรสาคร เทศบาลนครอ้อมน้อย
- Chiang Mai (5 areas): เทศบาลเมืองเมืองแกนพัฒนา เทศบาลเมืองแม่เหียะ เทศบาลเมืองแม่โจ้ เทศบาลเมืองต้นเปา เทศบาลนครเชียงใหม่
- Khon Kaen (7 areas): เทศบาลเมืองเมืองพล เทศบาลเมืองกระนวน เทศบาลเมืองชุมแพ เทศบาลเมืองบ้านไผ่ เทศบาลเมืองบ้านทุ่ม เทศบาลเมืองศิลา เทศบาลนครขอนแก่น
- Phuket (3 areas): เทศบาลเมืองกะทู้ เทศบาลเมืองป่าตอง เทศบาลนครภูเก็ต
- Songkhla (12 areas): เทศบาลเมืองเขารูปช้าง เทศบาลเมืองคลองแห เทศบาลเมืองควนลัง เทศบาลเมืองคอหงส์ เทศบาลเมืองทุ่งตำเสา เทศบาลเมืองบ้านพรุ เทศบาลเมืองปาดังเบซาร์ เทศบาลเมืองม่วงงาม เทศบาลเมืองสะเดา เทศบาลเมืองสิงหนคร เทศบาลนครสงขลา เทศบาลนครหาดใหญ่
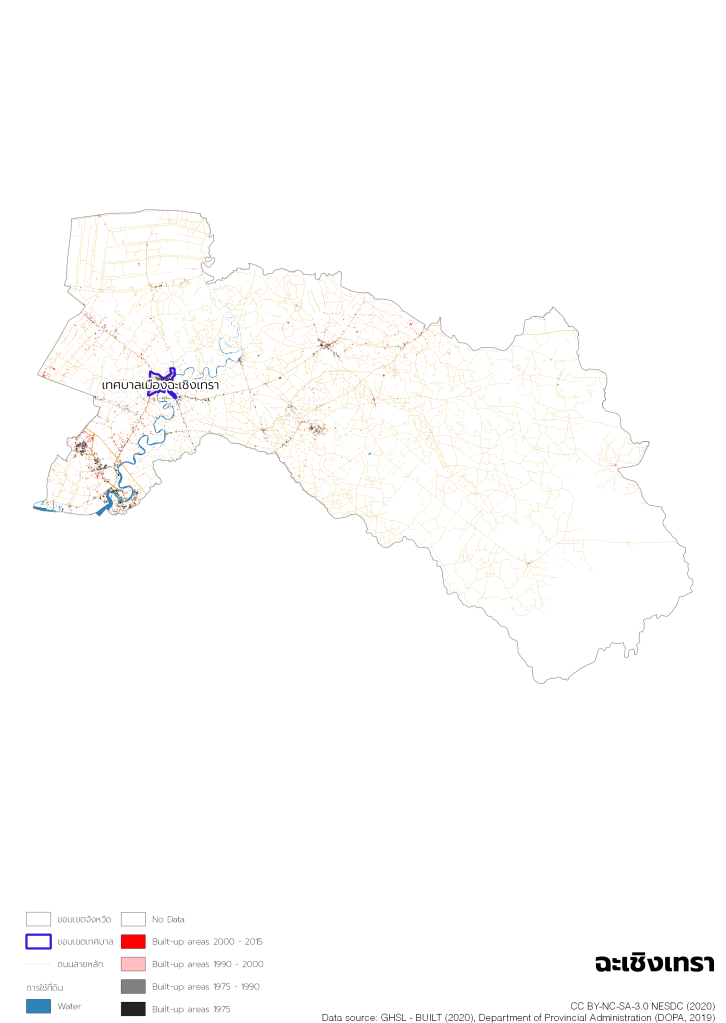
- Chachoengsao (1 area): เทศบาลเมืองฉะเชิงเทรา
- Chonburi (12 areas): เทศบาลเมืองแสนสุข เทศบาลเมืองชลบุรี เทศบาลเมืองบ้านบึง เทศบาลเมืองบ้านสวน เทศบาลเมืองปรกฟ้า เทศบาลเมืองพนัสนิคม เทศบาลเมืองสัตหีบ เทศบาลเมืองหนองปรือ เทศบาลเมืองอ่างศิลา เทศบาลนครเจ้าพระยาสุรศักดิ์ เทศบาลนครแหลมฉบัง เมืองพัทยา
- Rayong (3 areas): เทศบาลเมืองบ้านฉาง เทศบาลเมืองมาบตาพุด เทศบาลนครระยอง
The Definition of Urban Areas
Tessaban Nakhon and Tessaban Mueang are used as the proxies of urban areas in accordance with their minimum population requirements of 10,000 (Tessaban Mueang) and 50,000 (Tessaban Nakhon) under the Municipal Act (No. 14) B.E. 2562 of Thailand. The GIS layer (shapefile) of Tessaban boundaries is collected by reviewing the official Tessaban foundation annoucements, and aggregating Tessaban boundaries from Tambon (Sub-district) boundaries as a base layer. Tambon layer is used as a base layer because it is the smallest administration unit available in Shapefile format. However, there are few Tessabans which their boundaries cover only a part of Tambon. In this case, we consider the whole Tambon as the Tessaban.
More information about Tessaban Shapefile is in this post.


Target & Indicator Summary
| Indicators | Before ‘SET ZERO’ | After ‘SET ZERO’ |
|---|---|---|
| 11.1.1 | Community Organization Development Institution | Community Organization Development Institution, National Housing Authority |
| 11.2.1 | – | GHSL Population Data, multiple public transportation datasets |
| 11.3.1 | – | Department of Land Development |
| 11.3.2 | – | – |
| 11.4.1 | – | Bureau of Budget, National Statistical Office |
| 11.5.1 | Department of Disaster Prevention and Mitigation | Other NESDC division |
| 11.5.2 | Department of Disaster Prevention and Mitigation | – |
| 11.6.1 | Department of Industrial Works | Department of Pollution Control |
| 11.6.2 | – | Department of Pollution Control, AQICN.org |
| 11.7.1 | – | Open Street Map, Office of Natural Resources and Environmental Policy and Planning |
| 11.7.2 | – | – |
| 11.a.1 | – | NESDC |
| 11.b.1 | – | Other NESDC division |
| 11.b.2 | – | Other NESDC division |
| 11.c.1 | – | Proposed to be excluded from the report |
Target 11.1
11.1 By 2030, ensure access for all to adequate, safe and affordable housing and basic services and upgrade slums (ภายในปี 2573 สร้างหลักประกันการเข้าถึงที่อยู่อาศัยและบริการพื้นฐานที่พอเพียง ปลอดภัย ในราคาที่จ่ายได้ และยกระดับชุมชนแออัด)
Indicator 11.1.1
11.1.1 Proportion of urban population living in slums, informal settlements or inadequate housing (สัดส่วนประชากรเมืองที่อาศัยในสลัม การตั้งถิ่นฐานไม่เป็นทางการ หรือที่อยู่อาศัยไม่เพียงพอ)
Former data source: Community Organizations Development Institute (สถาบันพัฒนาองค์กรชุมชน (องค์การมหาชน))
Current data sources: Community Organizations Development Institute and National Housing Authority’s Low-income Communities Report B.E. 2560 (2017) (รายงานข้อมูลชุมชนผู้มีรายได้น้อย 2560)
UN Metadata: The indicator considers two components to be computed as (1) slum/Informal Settlements households (SISH), and (2) inadequate housing households (IHH). Data for the slum/informal settlements components of the indicator can be computed from Census and national household surveys, including DHS and MICS. Data for the inadequate housing component can be computed through income and household surveys that capture housing expenditures.

NESDC Methodology
Using the reported numbers from Community Organizations Development Institute and National Housing Authority’s Low-income Communities Report B.E. 2560 (2017) (รายงานข้อมูลชุมชนผู้มีรายได้น้อย 2560)
Target 11.2
11.2 By 2030, provide access to safe, affordable, accessible and sustainable transport systems for all, improving road safety, notably by expanding public transport, with special attention to the needs of those in vulnerable situations, women, children, persons with disabilities and older persons (ภายในปี 2573 จัดให้มีการเข้าถึงระบบคมนาคมขนส่งที่ยั่งยืน เข้าถึงได้ ปลอดภัย ในราคาที่จ่ายได้ สำหรับทุกคน ปรับปรุงความปลอดภัยทางถนน ขยายการขนส่งสาธารณะ โดยให้ความสำคัญกับความต้องการของกลุ่มเปราะบาง อาทิ สตรี เด็ก ผู้พิการและผู้สูงอายุ)
Indicator 11.2.1
11.2.1 Proportion of population that has convenient access to public transport, by sex, age and persons with disabilities (สัดส่วนประชากรเมืองที่เข้าถึงการขนส่งสาธารณะอย่างสะดวก จำแนกตามเพศ อายุ และผู้พิการ)
Former data source: no data
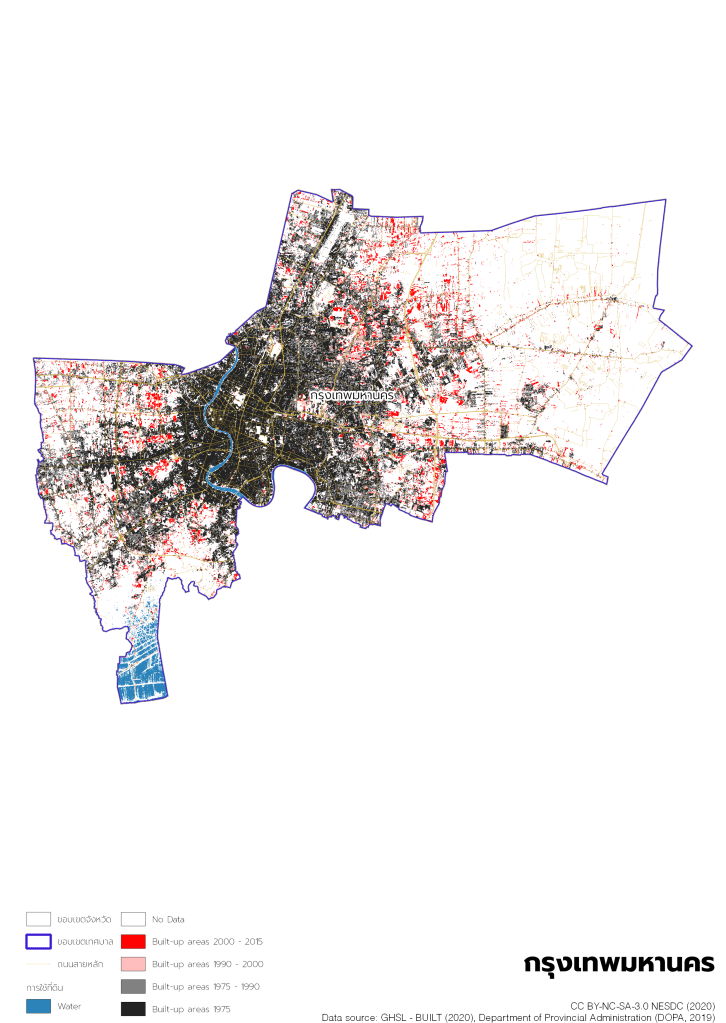
Current data source: (1) Population dataset: Global Human Settlement Layer (GHSL), population epoch 2015 (POP2015), resolution 9 arcsec, WGS 84 coordination system (GHS_POP_E2015_GLOBE_R2019A_4326_9ss_V1_0)
(2) Public transport dataset: multiple sources listed in the following table
UN Metadata: The identification of service areas is typically achieved using the buffering operation (using GIS) by constructing lines of equal proximity around each public transport stop or each public transport route. The actual and recommended data sources for this indicator are the following:
- Data on location of public transport stops in city: city administration or service providers, GIS data
- Dwelling units within 500m of public transport stops: Census, GIS data
- Number of residents per dwellings unit: Census/household survey
- Household surveys that collect information on the proportion of households that declare they have access to public means of transport within 0.5 km. These surveys can also collect information about the quality of the service.
NESDC Methodology
- Overlay the population dataset by the distant buffer layer (400 – 500 m from public transits).
- Population with convenient access to public transport is considered by their walking distance to a nearest station/stop. According to this article, the distances of 400 meters (for smaller stations i.e. Chaophraya boat & ferry, San Sab speed boat, Bus Rapid Transit (BRT), bus) and 500 meters (for bigger stations i.e. BTS, MRT, Airport Rail Link (ARL), train) from a station/stop are used for calculation.
| Areas | Modes of transportation used in this methodology | Sources | Input method(s) / file extension(s) |
|---|---|---|---|
| Bangkok and its vicinities: Nakhon Pathom, Nonthaburi, Pathum Thani, Samut Prakan, Samut Sakhon | BTS, MRT, Airport Rail Link (ARL), train, Chaophraya boat & ferry, San Sab speed boat, Bus Rapid Transit (BRT), bus | – Bangkok GIS (all modes of transportation except bus) – Bus | Shapefile (point) / KML |
| Chiang Mai | Bus | Chiang Mai City Update | KML (point) |
| Khon Kaen | Bus | Khon Kaen City Bus | Manual digitization |
| Phuket | Bus and minibus | – Phuket Smart Bus – Phuket Mini Bus | KML (point) / manual digitization |
| Songkhla (Hat Yai only) | Bus and minibus | – Hat Yai Bus – Hat Yai Mini Bus | Manual digitization |
| Eastern Economic Corridor (EEC) provinces: Chachoengsao, Chonburi, Rayong | Chachoengsao: NA Chonburi: minibus in Bangsaen and Pattaya Rayong: in-town minibus | – Bang Saen Mini Bus – Pattaya Mini Bus | KML (line) |

GHSL population data overlaid by 400 – 500 m buffer from public transit 
Target 11.3
11.3 By 2030, enhance inclusive and sustainable urbanization and capacity for participatory, integrated and sustainable human settlement planning and management in all countries (ภายในปี 2573 เสริมสร้างการเป็นเมืองที่ยั่งยืนและครอบคลุมและสมรรถภาพสำหรับการวางแผนและและการจัดการด้านการตั้งถิ่นฐานมนุษย์อย่างยั่งยืนและบูรณาการในทุกประเทศ)
Indicator 11.3.1
11.3.1 Ratio of land consumption rate to population growth rate (ตราส่วนระหว่างอัตราการใช้ที่ดิน ต่ออัตราการเติบโตของประชากร)
Former data source: no data
Current data sources: Department of Land Development (กรมพัฒนาที่ดิน) for land use data, Department of Provincial Administration (กรมการปกครอง) for population data
UN Metadata: The formula to estimate the land use efficiency will be provided with three stages, Stage 1: estimate the population growth rate, Stage 2: estimating the land consumption rate, and Stage 3: estimate the ratio of land consumption rate to population growth rate (LCRPGR).
LCRPGR = (+ ( Land Consumption rate)/(Annual Population growth rate)¦)
Several sources of information are required for this computation: Satellite imagery from open sources or the exact measurements in km squared of the built up areas or the land that is fully developed in Km squared, annual urban population data for the reference years of analysis.
NESDC Methodology
Following UN’s suggested methodology using land use data from Department of Land Development and population data from Department of Provincial Administration (กรมการปกครอง).
Indicator 11.3.2
11.3.2 Proportion of cities with a direct participation structure of civil society in urban planning and management that operate regularly and democratically (สัดส่วนเมืองที่มีโครงสร้างการมีส่วนร่วมโดยตรงของภาคประชาสังคมในการวางแผนและจัดการเมืองที่ดำเนินการแบบประชาธิปไตยเป็นปกติ)
Former data source: no data
Current data source: not feasible as UN Metadata (E/CN .3/2020/2) suggests Scorecard Approach which requires expert selection and survey
Target 11.4
11.4 Strengthen efforts to protect and safeguard the world’s cultural and natural heritage (เสริมความเข้มแข็งในการพยายามปกป้องและคุ้มครองมรดกของโลกทางวัฒนธรรมและทางธรรมชาติ ไม่มี ไปถามกระทรวงอื่น)
Indicator 11.4.1
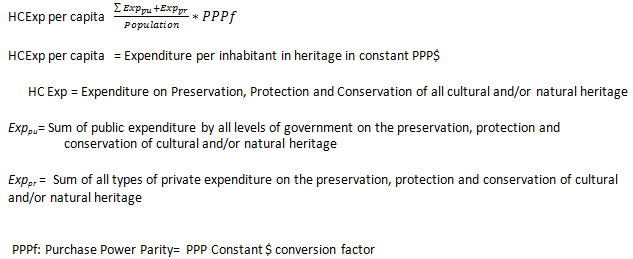
11.4.1 Total expenditure (public and private) per capita spent on the preservation, protection and conservation of all cultural and natural heritage, by type of heritage (cultural, natural, mixed and World Heritage Centre designation), level of government (national, regional and local/municipal), type of expenditure (operating expenditure/investment) and type of private funding (donations in kind, private non-profit sector and sponsorship) (ค่าใช้จ่ายทั้งหมดต่อประชากรในการสงวนรักษา การปกป้องและการอนุรักษ์มรดกทางวัฒนธรรมและธรรมชาติทั้งหมด จำแนกตามแหล่งเงิน (รัฐและเอกชน) ตามประเภทของมรดก (วัฒนธรรมและธรรมชาติ) และระดับของภาครัฐ (ประเทศ ภาค และท้องถิ่น (เทศบาล)))
Former data source: no data
Current data sources: (1) Bureau of the Budget (สำนักงบประมาณ) for government budget on natural and cultural conservation and preservation (เอกสารงบประมาณฉบับที่ 3 งบประมาณรายจ่ายประจำปีงบประมาณประจำปี พ.ศ. …. เอกสารงบประมาณโดยสังเขป ฉบับปรับปรุง ตามพระราชบัญญัติงบประมาณรายจ่ายประจำปีงบประมาณ พ.ศ. 25…. ), (2) Department of Provincial Administration for population data, (3) Calculated by NESDC following UN Metadata (E/CN .3/2020/2) Global indicator framework for the Sustainable Development Goals and targets of the 2030 Agenda for Sustainable Development
* no budget data of the private sector
UN Metadata: The indicator is calculated by dividing total public funding in heritage (i.e. including transfers paid but excluding transfers received) from government (central, regional, local) and the total of private funding from households, other private sources such as donations, sponsorships or international sources in a given year by the number of inhabitants and by the PPP$ conversion factor.
NESDC Methodology
Using the budget data from Bureau of Budget and following UN’s suggested calculation methods.
Target 11.5
11.5 By 2030, significantly reduce the number of deaths and the number of people affected and substantially decrease the direct economic losses relative to global gross domestic product caused by disasters, including water-related disasters, with a focus on protecting the poor and people in vulnerable situations (ภายในปี 2573 ลดจำนวนการตายและจำนวนผู้ที่ได้รับผลกระทบจากภัยพิบัติ ลดการสูญเสียโดยตรงทางเศรษฐกิจเปรียบเทียบกับผลิตภัณฑ์มวลรวมระดับโลก อันเกิดจากภัยพิบัติทางน้ำ และมุ่งเน้นการปกป้องผู้ยากไร้และผู้ที่อยู่ในสถานการณ์เปราะบาง)
Indicator 11.5.1
11.5.1 Number of deaths, missing persons and persons affected by disaster per 100,000 peoplea (จำนวนผู้เสียชีวิต ผู้สูญหาย และผู้ที่ได้รับผลกระทบโดยตรงจากภัยพิบัติ ต่อประชากร 100,000 คน)
Former data sources: (1) Department of Disaster Prevention and Mitigation (กรมป้องกันและบรรเทาสาธารณภัย) on Number of deaths, injured, and impacted population from floods, fire, storms, and droughts per 100,000 population and (2) Calculated to be per 100,000 population by National Statistical Office (สำนักงานสถิติแห่งชาติ)
Current data source: not conducted by UDSD, identical to SDG 13.1.1
Indicator 11.5.2
11.5.2 Direct disaster economic loss in relation to global GDP, including disaster damage to critical infrastructure and disruption of basic services (ความสูญเสียโดยตรงทางเศรษฐกิจเปรียบเทียบกับ ผลิตภัณฑ์มวลรวมระดับโลก ความเสียหายระดับรุนแรงต่อโครงสร้างพื้นฐาน และจำนวนบริการพื้นฐานที่หยุดชะงัก)
Former data source: no data
Current data source: not conducted by UDSD
Target 11.6
11.6 By 2030, reduce the adverse per capita environmental impact of cities, including by paying special attention to air quality and municipal and other waste management (ภายในปี 2573 ลดผลกระทบเชิงลบต่อสิ่งแวดล้อมของเมืองซึ่งเกิดจากประชากรแต่ละคน โดยให้ความสำคัญกับคุณภาพอากาศและการจัดการขยะมูลฝอยชุมชนและขยะอื่นๆ)
Indicator 11.6.1
11.6.1 Proportion of urban solid waste regularly collected and with adequate final discharge out of total urban solid waste generated, by cities (สัดส่วนขยะมูลฝอยชุมชนที่มีการเก็บรวบรวมและจัดการในสถานที่ควบคุม ต่อปริมาณขยะมูลฝอยชุมชนทั้งหมด จำแนกตามเมือง)
Former data source: Department of Industrial Works (กรมโรงงานอุตสาหกรรม)
Current data source: Department of Pollution Control (กรมควบคุมมลพิษ)
UN Metadata: The numerator of this indicator is ‘municipal solid waste regularly collected with adequate final treatment and disposal’ and the denominator is ‘total municipal solid waste generated by the city’.

NESDC Methodology
Using the reported numbers from Department of Pollution Control
Indicator 11.6.2
11.6.2 Annual mean levels of fine particulate matter (e.g. PM2.5 and PM10) in cities (population weighted) (ระดับฝุ่นขนาดเล็กเฉลี่ยรายปี (PM2.5 และ PM10) ในเมือง ถ่วงน้ำหนักด้วยจำนวนประชากร)
Former data source: no data
Current data source: Department of Pollution Control (กรมควบคุมมลพิษ) and AQICN.org
UN Metadata: The annual urban mean concentration of PM2.5 is estimated with improved modelling using data integration from satellite remote sensing, population estimates, topography and ground measurements (WHO, 2016a; Shaddick et al, 2016). Sources of data include ground measurements from monitoring networks, collected for 3,000 cities and localities (WHO 2016) around the world, satellite remote sensing, population estimates, topography, information on local monitoring networks and measures of specific contributors of air pollution (WHO, 2016b)
NESDC Methodology
- Province is use as the unit instead of Tessaban because pollution issue should be considered in the bigger scale.
- Calculate daily average of PM 2.5 and PM 10 by province from all stations within the boundaries
- Calculate annual average of PM 2.5 and PM 10 by province

Target 11.7
11.7 By 2030, provide universal access to safe, inclusive and accessible, green and public spaces, in particular for women and children, older persons and persons with disabilities (ภายในปี 2573 จัดให้มีการเข้าถึงพื้นที่สีเขียวสาธารณะอย่างกว้างขวาง ครอบคลุมและเข้าถึงได้ โดยให้ความสำคัญกับสตรี เด็ก ผู้สูงอายุและผู้พิการ)
Indicator 11.7.1
11.7.1 Average share of the built-up area of cities that is open space for public use for all, by sex, age and persons with disabilities (สัดส่วนเฉลี่ยของพื้นที่ที่มีสิ่งก่อสร้างของเมือง ซึ่งเป็นพื้นที่เปิดสำหรับใช้ประโยชน์โดยสาธารณะทั่วไป จำแนกตามเพศ อายุ และผู้พิการ)
Former data source: no data
Current data sources: (1) Open Street Map’s road networks as of May 4, 2020, (2) Office of Natural Resources and Environmental Policy and Planning (ONEP)’s Thai Green Urban database, (3) Department of Highways’ road design standard
UN Metadata: The methodology is a three-step process:
- Spatial analysis to delimit the built-up area of the city
- Spatial analysis to identify potential open public spaces, field work to validate data and access the quality of spaces and calculation of the total area occupied by the verified open public spaces
- Estimation of the total area allocated to streets


Samples of road networks used in the analyses
NESDC Methodology
- (LAS) Download and apply OSM road network tags to Thai contexts. Open Street Map (OSM) is a crowdsource global map database. Roads are digitized (from satellite imagery) and categorized by volunteers under OSM defined data tags (attribute name: fclass) which are designed to cover and standardize different road types of different countries. Along with the fact that the data is digitized by volunteers, there are some possible nuances in data tagging process.
- (LAS) Estimate road areas from Department of Highways’ road design standard (2017).
- (Total surface of open public space) Calculate proportion of the selected green spaces i.e. Public Green Areas (พื้นที่สีเขียวสาธารณะ, id = 1) and Green Stripes (พื้นที่สีเขียวริ้วยาวตามแนวสาธารณูปการ, id = 3) to Tessaban total area.

Department of Highways’ road design standard 
List of road types categorized by OSM, their applications to Thai contexts, and their surface area estimations 
Example of public open spaces in Chonburi’s urban areas
Indicator 11.7.2
11.7.2 Proportion of persons victim of physical or sexual harassment, by sex, age, disability status and place of occurrence, in the previous 12 months (สัดส่วนบุคคลที่เป็นเหยื่อการคุกคามทางกายและทางเพศ จำแนกตามเพศ อายุ สภาพความพิการ และสถานที่เกิดเหตุ ในรอบ 12 เดือนที่ผ่านมา)
Former data source: no data
Current data source: not conducted by UDSD (scope exceeds UDSD’s responsibilities)
Target 11.A
11.A Support positive economic, social and environmental links between urban, peri-urban and rural areas by strengthening national and regional development planning (สนับสนุนการเชื่อมโยงเชิงบวกทางเศรษฐกิจ สังคมและสิ่งแวดล้อมระหว่างเมือง ชานเมือง และชนบท โดยเสริมความเข้มแข็งในการวางแผนพัฒนาระดับชาติและภูมิภาค แผนพัฒนาจังหวัด)
Indicator 11.a.1
11.a.1 Proportion of population living in cities that implement urban and regional development plans integrating population projections and resource needs, by size of city (จำนวนประเทศที่มีนโยบายเกี่ยวกับเมืองระดับชาติ หรือแผนการพัฒนาภาค ซึ่งมี (ก) ความสอดคล้องกับพลวัตของประชากร (ข) ความสมดุลของการพัฒนาเชิงพื้นที่ และ (ค) การเพิ่มพื้นที่ทางการคลังของท้องถิ่น)
Former data source: no data
Current data source: NESDC
NESDC Methodology
Reporting the rationales and progress of Master Plan under the National Strategy on Smart Livable Cities.
Target 11.B
11.B By 2020, substantially increase the number of cities and human settlements adopting and implementing integrated policies and plans towards inclusion, resource efficiency, mitigation and adaptation to climate change, resilience to disasters, and develop and implement, in line with the Sendai Framework for Disaster Risk Reduction 2015-2030, holistic disaster risk management at all levels (ภายในปี 2563 เพิ่มจำนวนเมืองและการตั้งถิ่นฐานมนุษย์ที่รับและปฏิบัติตามนโยบายและแผนบูรณาการเพื่อบรรลุความครอบคลุม ประสิทธิภาพในการใช้ทรัพยากร การบรรเทาและการปรับตัวต่อการเปลี่ยนแปลงสภาพภูมิอากาศ ภูมิคุ้มกันต่อภัยพิบัติ รวมทั้งพัฒนาและปฏิบัติตาม กรอบเซ็นไดเพื่อการลดความเสี่ยงจากภัยพิบัติ พ.ศ. 2558-2573)
Indicator 11.b.1
11.b.1 Proportion of local governments that adopt and implement local disaster risk reduction strategies in line with the Sendai Framework for Disaster Risk Reduction 2015-2030 (จำนวนประเทศที่มียุทธศาสตร์ระดับชาติด้านการลดความเสี่ยงจากภัยพิบัติและมีการนำไปปฏิบัติ ซึ่งสอดคล้องกับกรอบเซ็นไดเพื่อการลดความเสี่ยงจากภัยพิบัติ พ.ศ. 2558-2573)
Former data source: Department of Disaster Prevention and Mitigation (กรมป้องกันและบรรเทาสาธารณภัย)
Current data source: not conducted by UDSD, identical to SDG 13.1.2
Indicator 11.b.2
11.b.2 Number of countries with national and local disaster risk reduction strategies (สัดส่วนของรัฐบาลท้องถิ่นที่มียุทธศาสตร์ด้านการลดความเสี่ยงจากการลดความเสี่ยงจากภัยพิบัติและมีการนำไปปฏิบัติ ซึ่งสอดคล้องกับยุทธศาสตร์ระดับชาติด้านการลดความเสี่ยงจากภัยพิบัติ)
Former data source: Department of Disaster Prevention and Mitigation (กรมป้องกันและบรรเทาสาธารณภัย)
Current data source: not conducted by UDSD, identical to SDG 13.1.3
Target 11.C
11.C Support least developed countries, including through financial and technical assistance, in building sustainable and resilient buildings utilizing local materials (สนับสนุนประเทศพัฒนาน้อยที่สุด ทั้งความช่วยเหลือด้านการเงินและวิชาการ ในการสร้างอาคารที่ยั่งยืนและทนทาน และใช้วัสดุท้องถิ่น)
Indicator 11.c.1
11.c.1 Proportion of financial support to the least developed countries that is allocated to the construction and retrofitting of sustainable, resilient and resource-efficient buildings utilizing local materials
Former data source: Department of Disaster Prevention and Mitigation (กรมป้องกันและบรรเทาสาธารณภัย)
Current data source: has been proposed to be excluded from the report
