NYC Traffic Incident Visualization


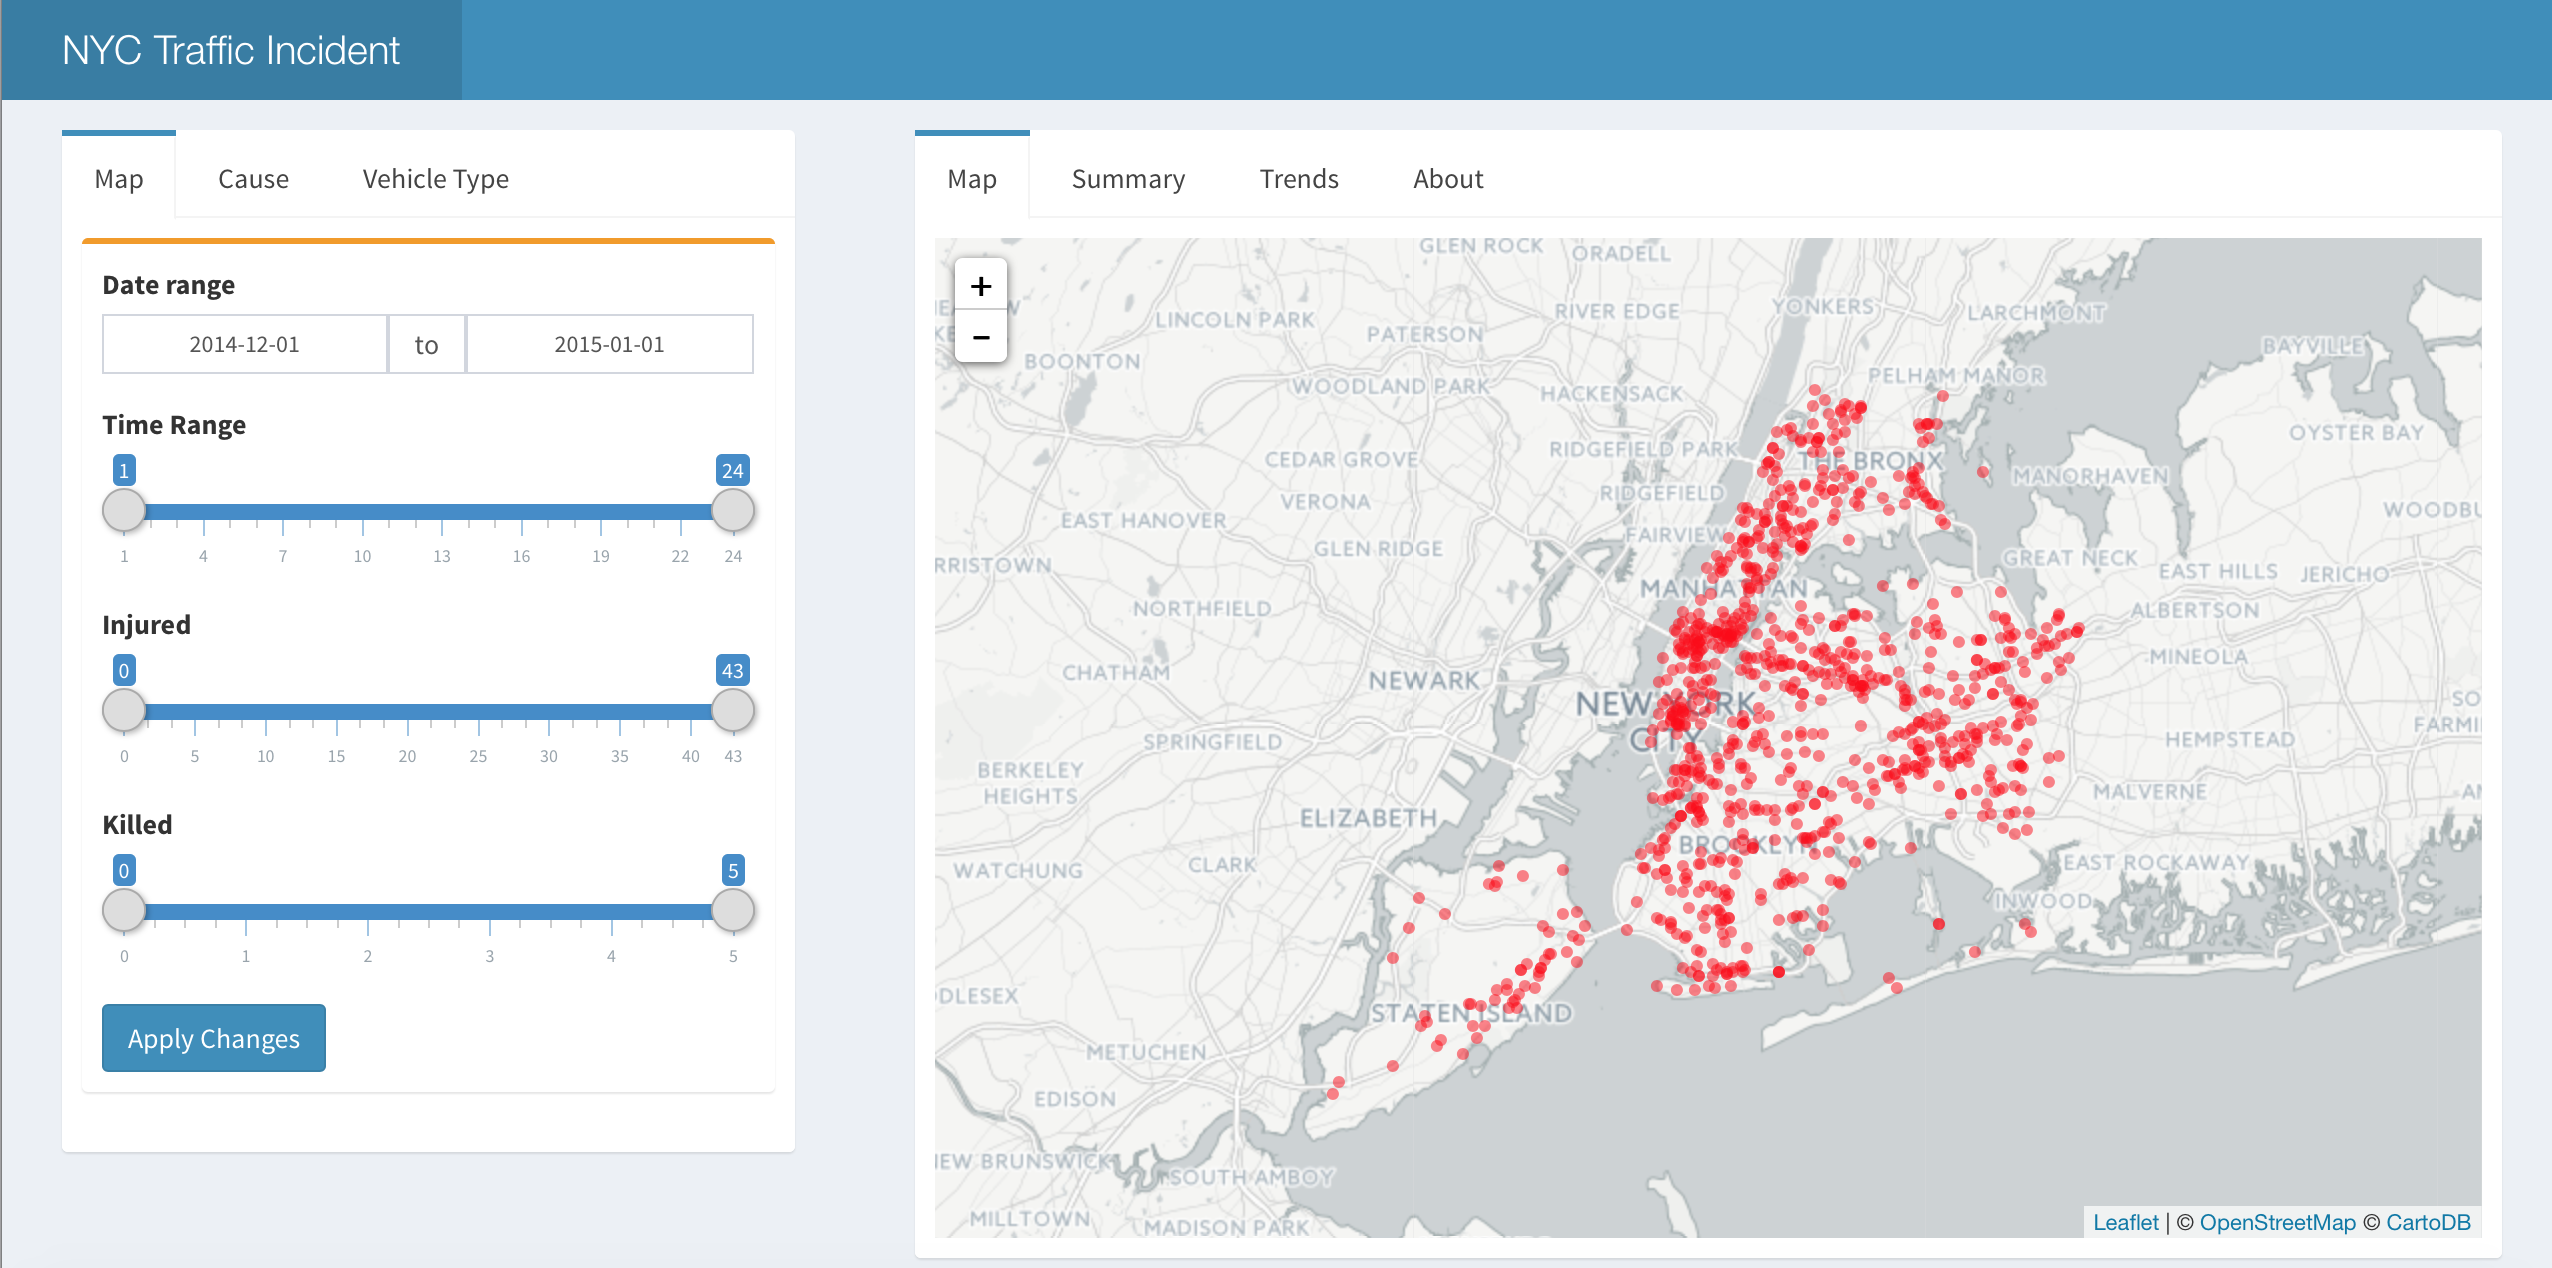
This app visualizes the traffic incident map of New York City, summarizes and predicts trend for the coming year. The traffic incident map can be customized using the sidebar panel to see incidents by date, time, number of persons injured or killed, causes and type of vehicles.

The app is hosted here. GitHub repository here

The data is obtained from NYPD Motor Vehicle Collisions

Screen Shot 2559-03-31 at 10.02.22 PM

Leave a Reply

Fill in your details below or click an icon to log in:

WordPress.com Logo

You are commenting using your WordPress.com account. Log Out /  Change )

Facebook photo

You are commenting using your Facebook account. Log Out /  Change )

Connecting to %s

This site uses Akismet to reduce spam. Learn how your comment data is processed.