
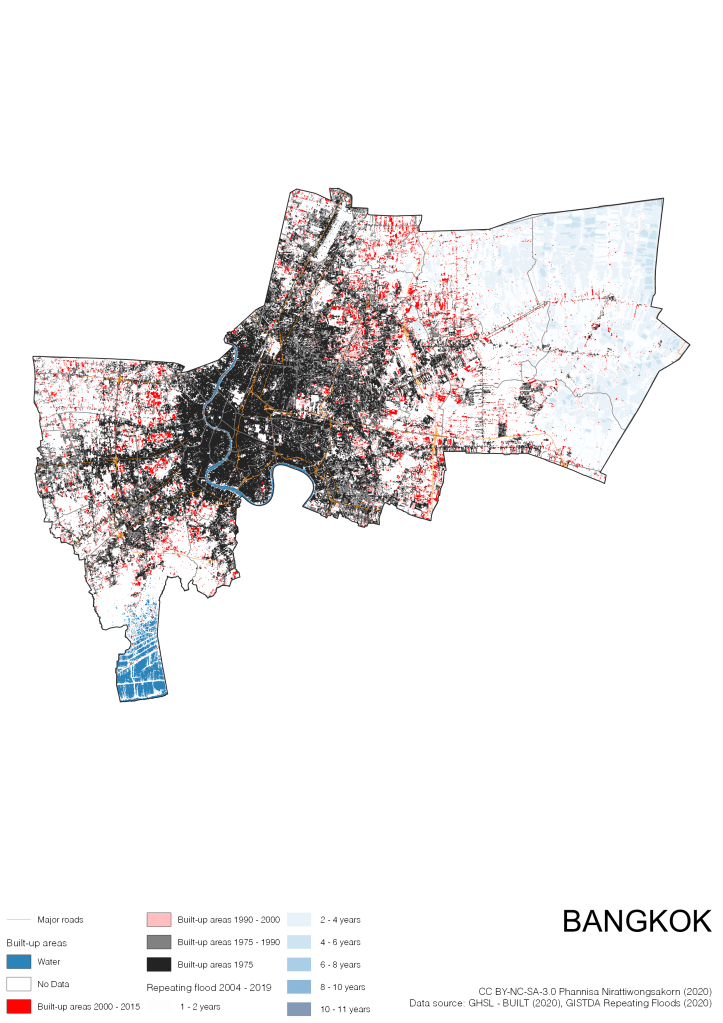
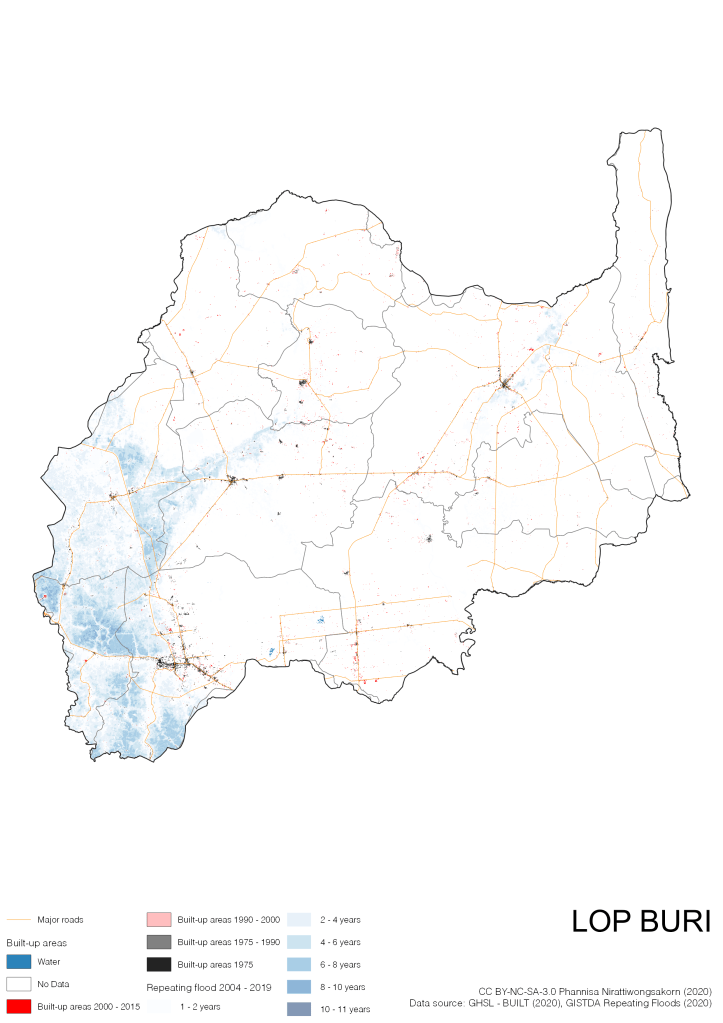
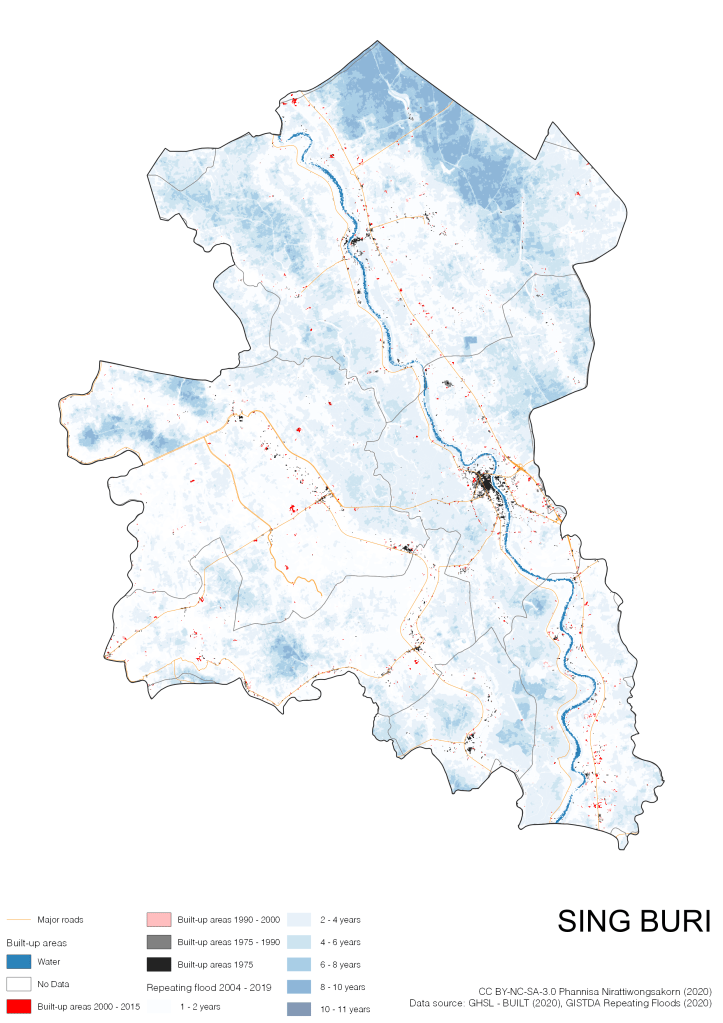
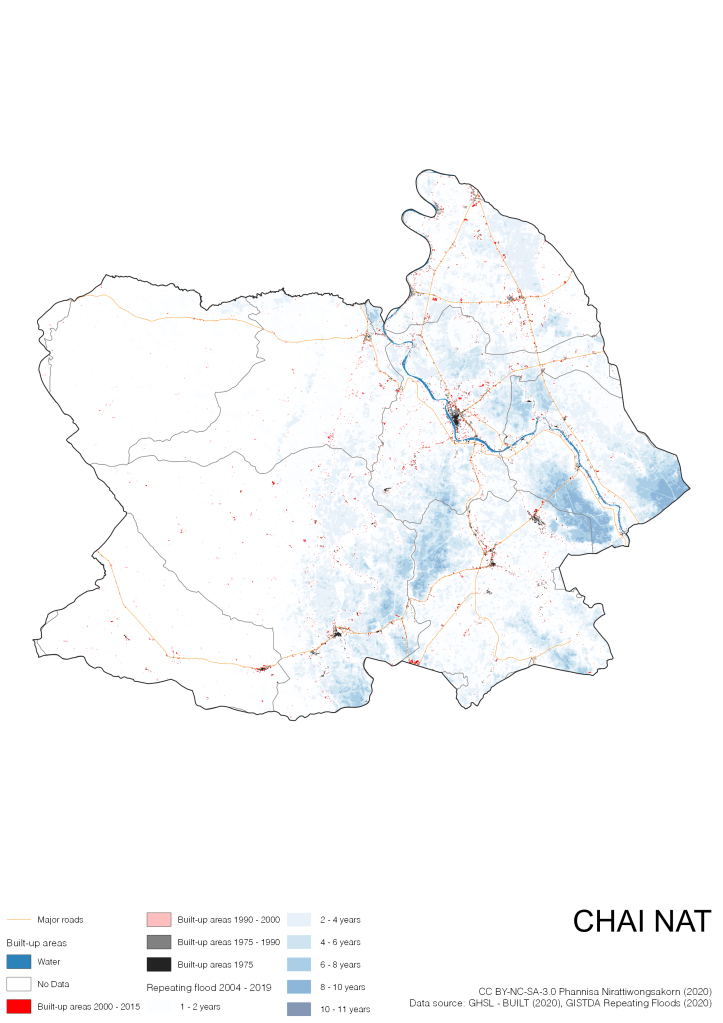
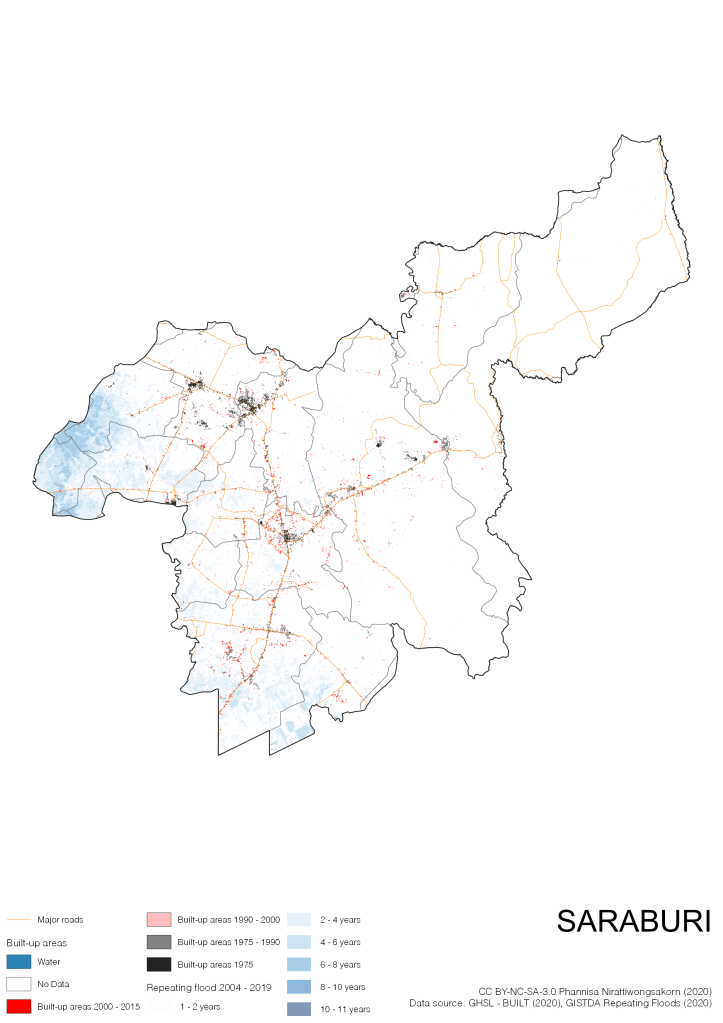
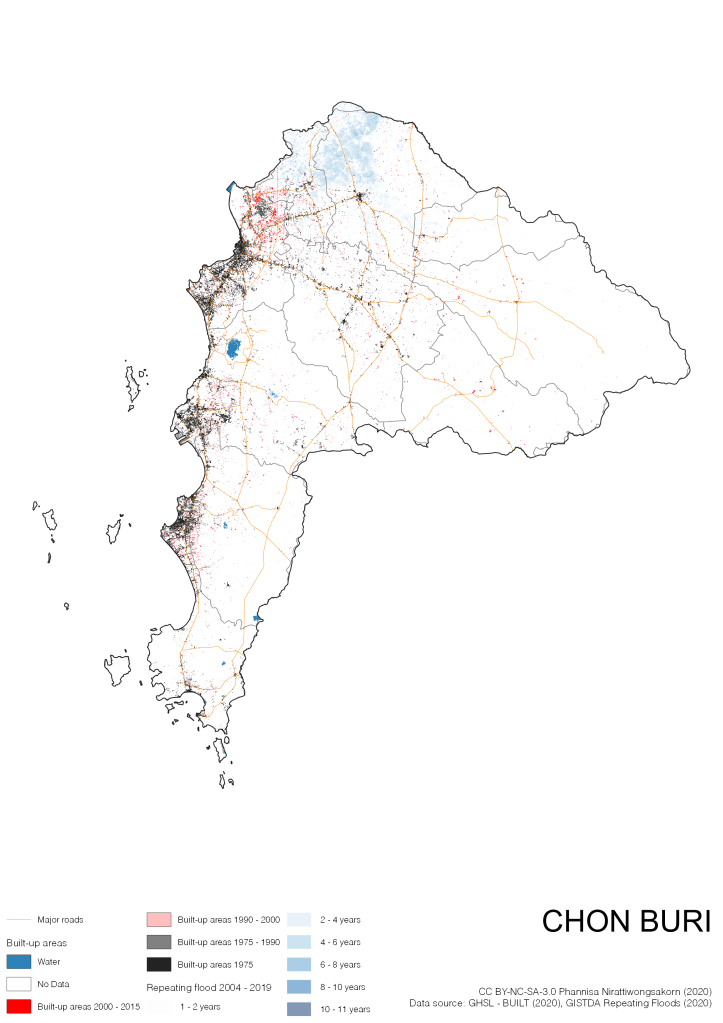
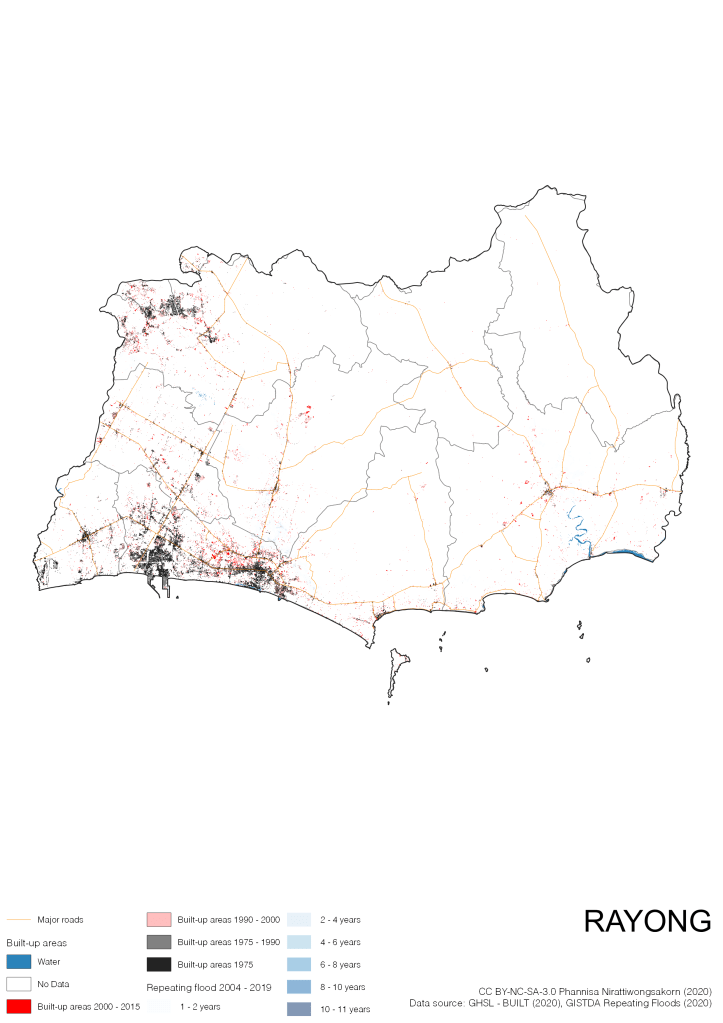
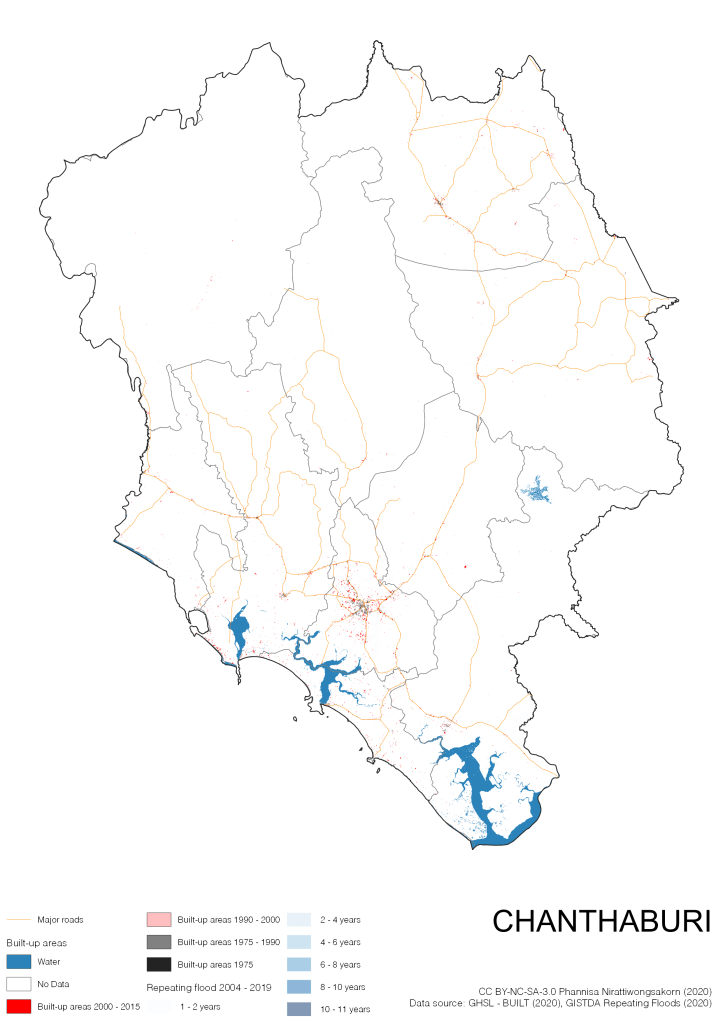
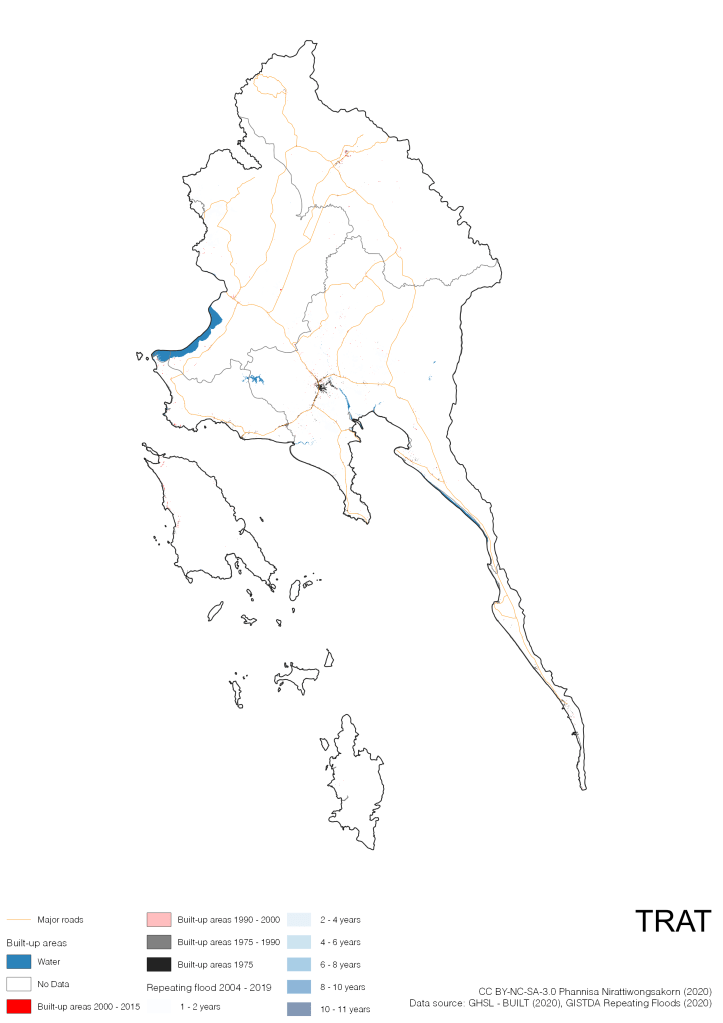
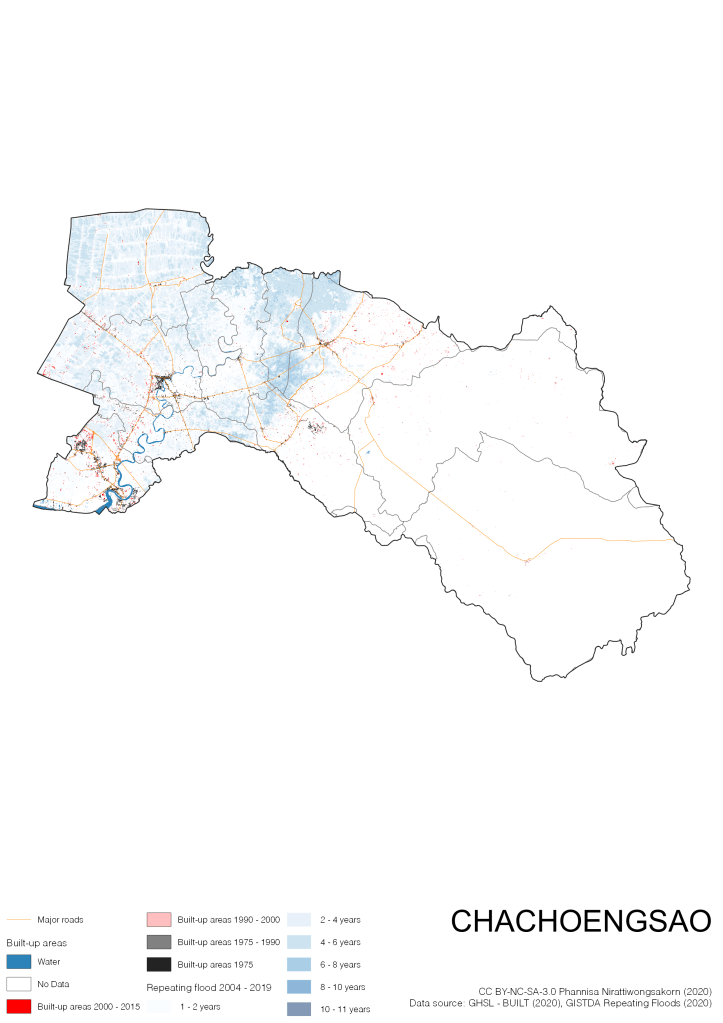
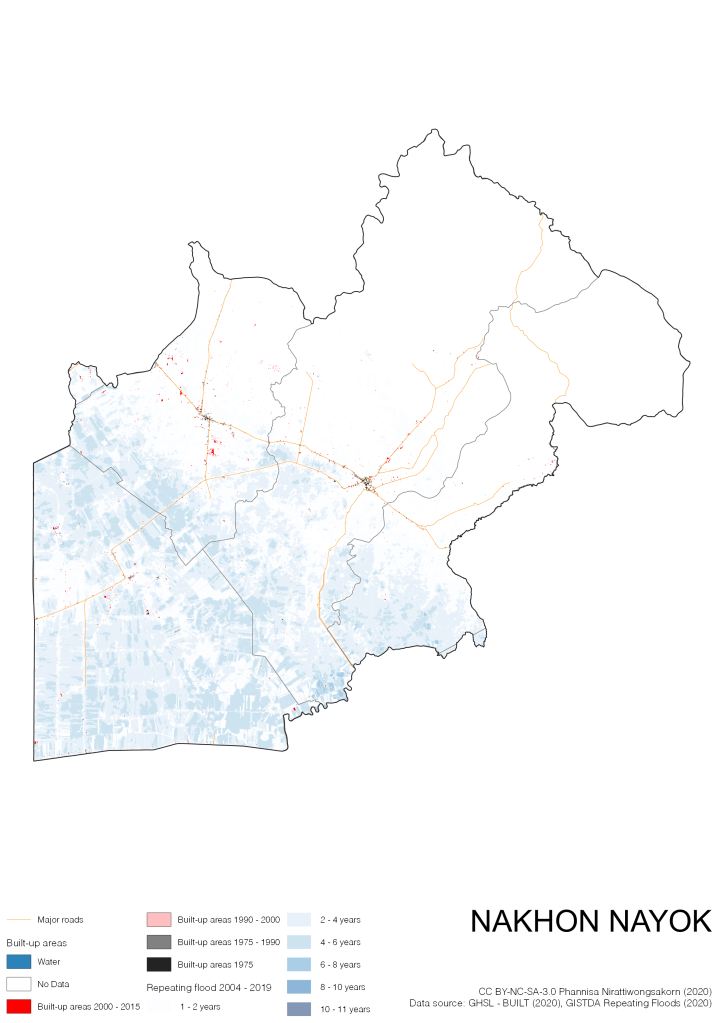
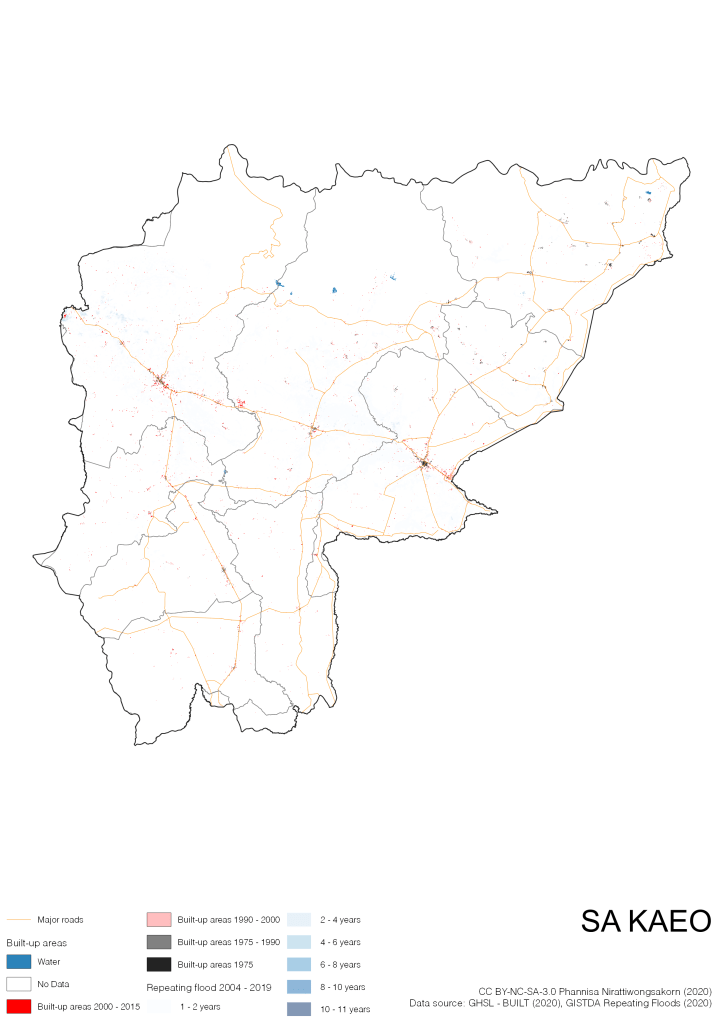
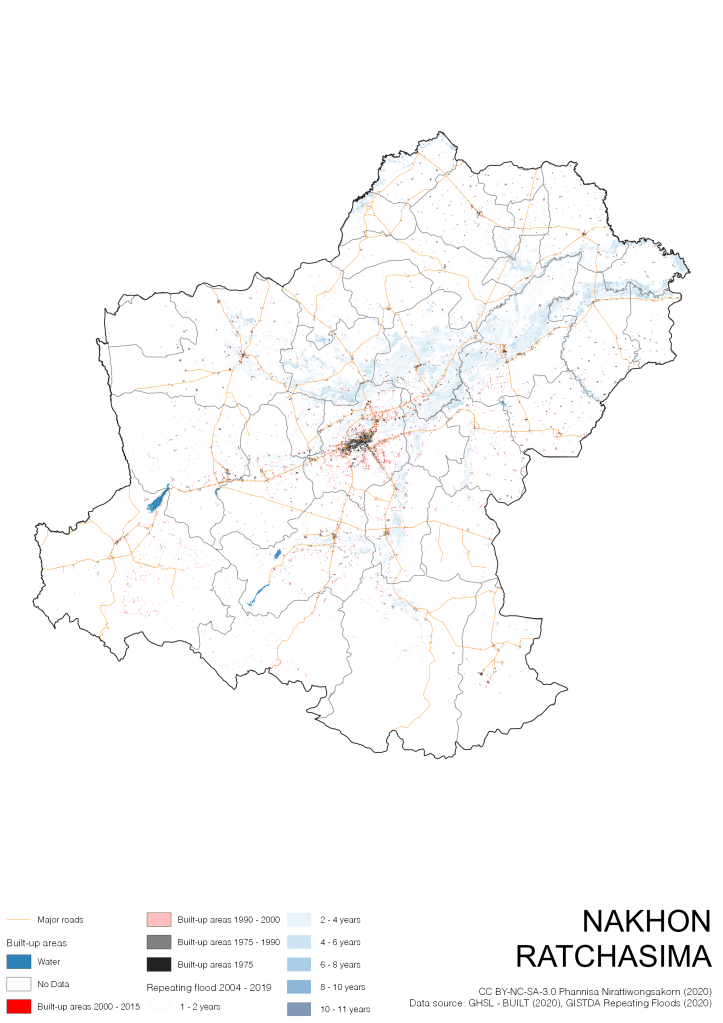
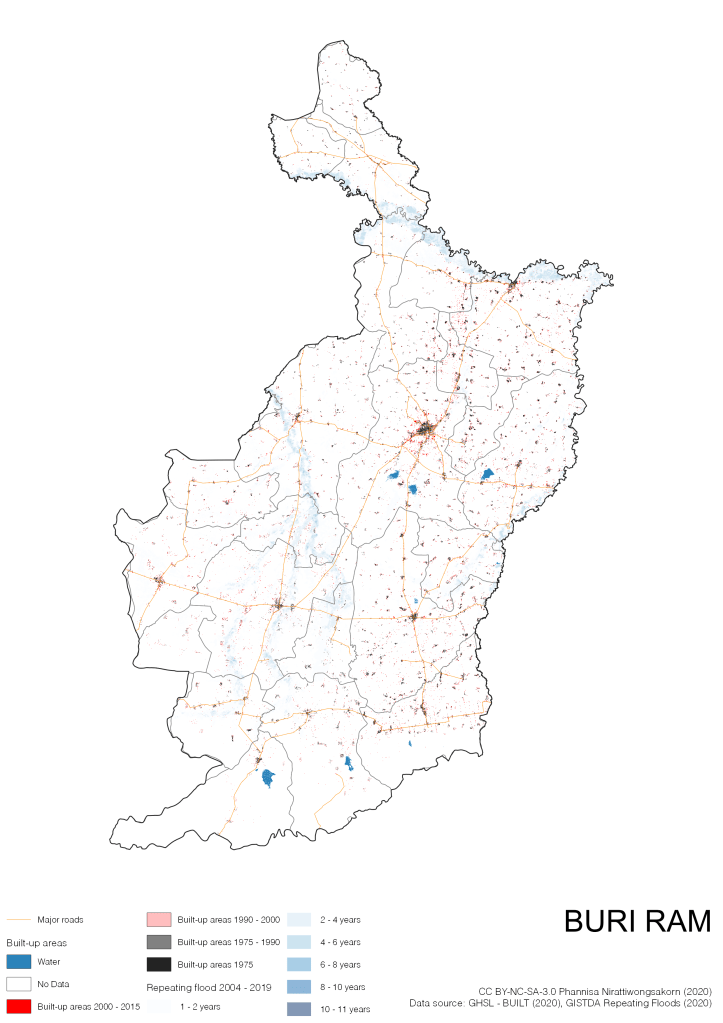
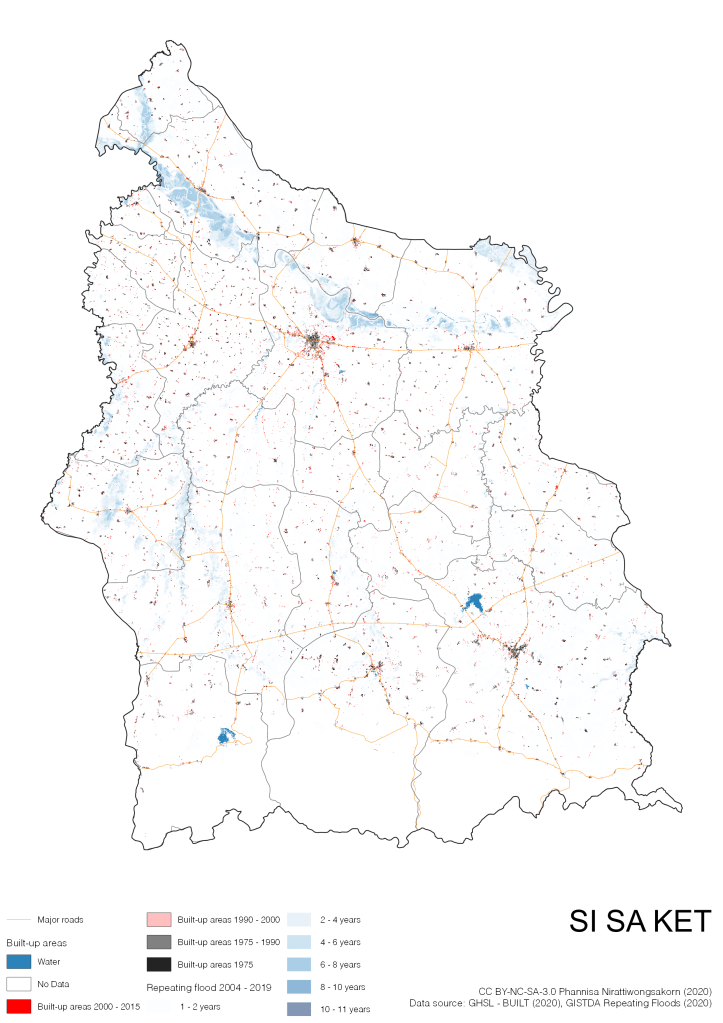
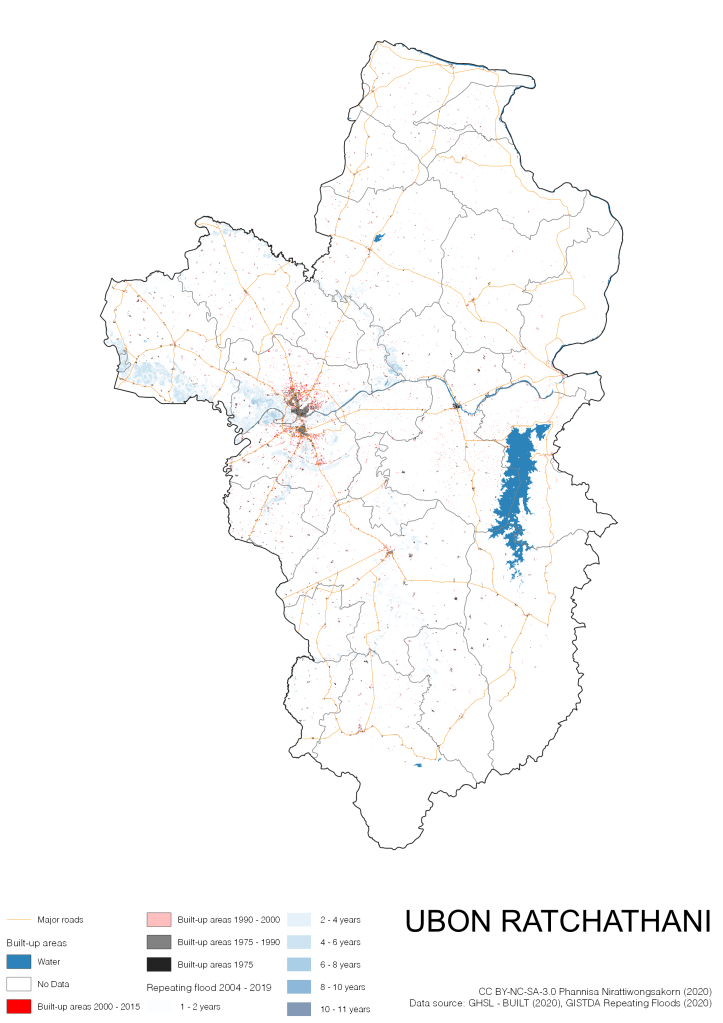
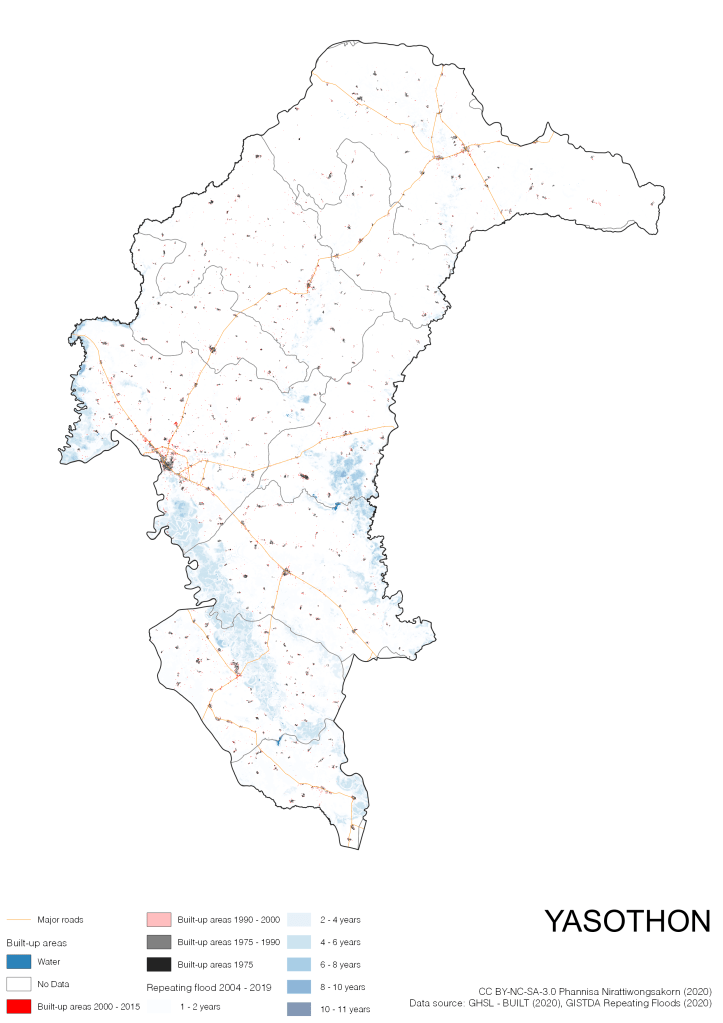
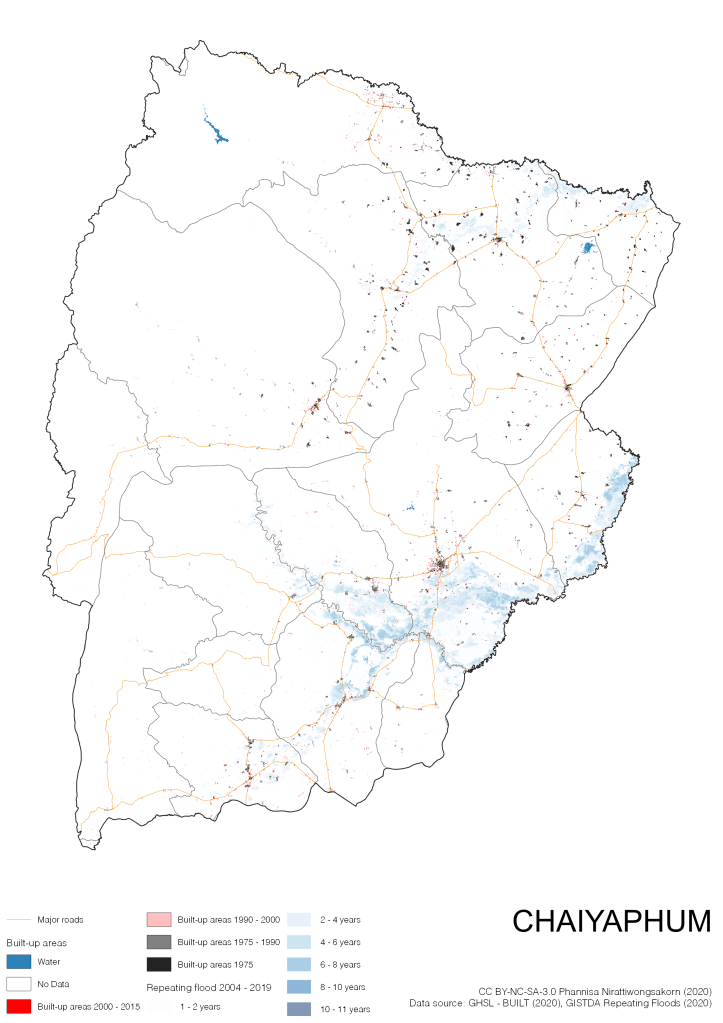
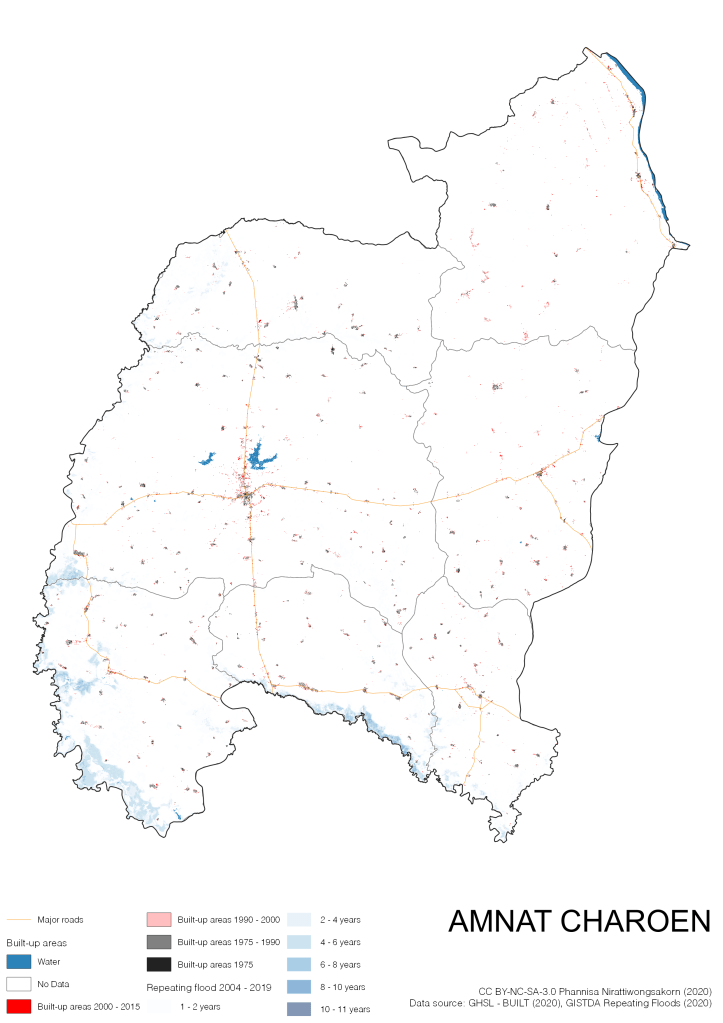
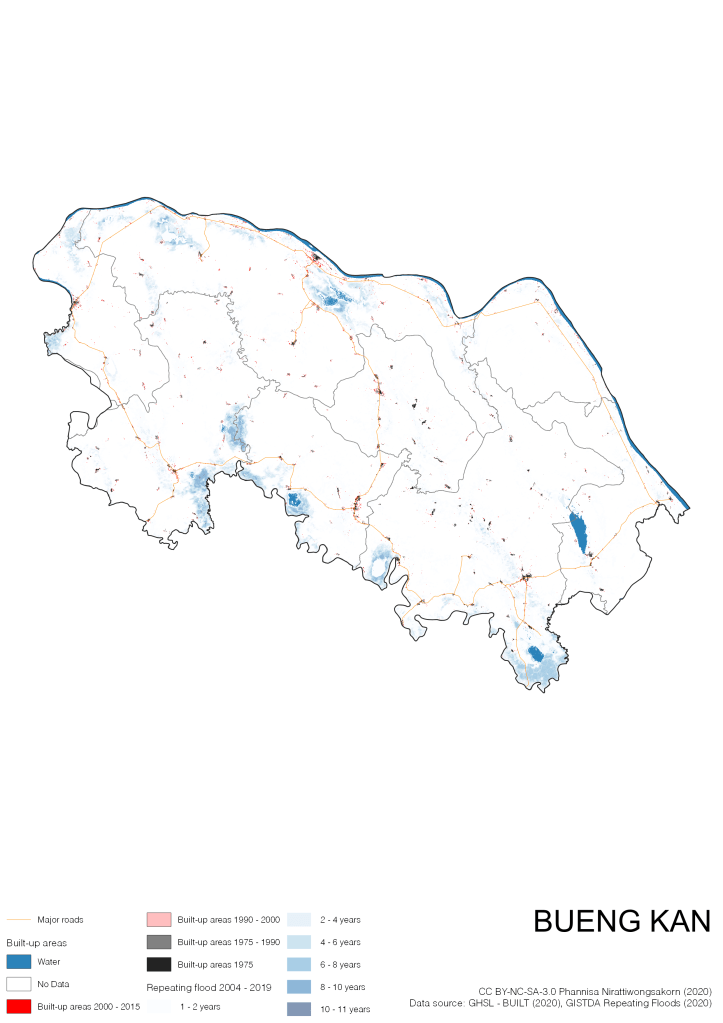
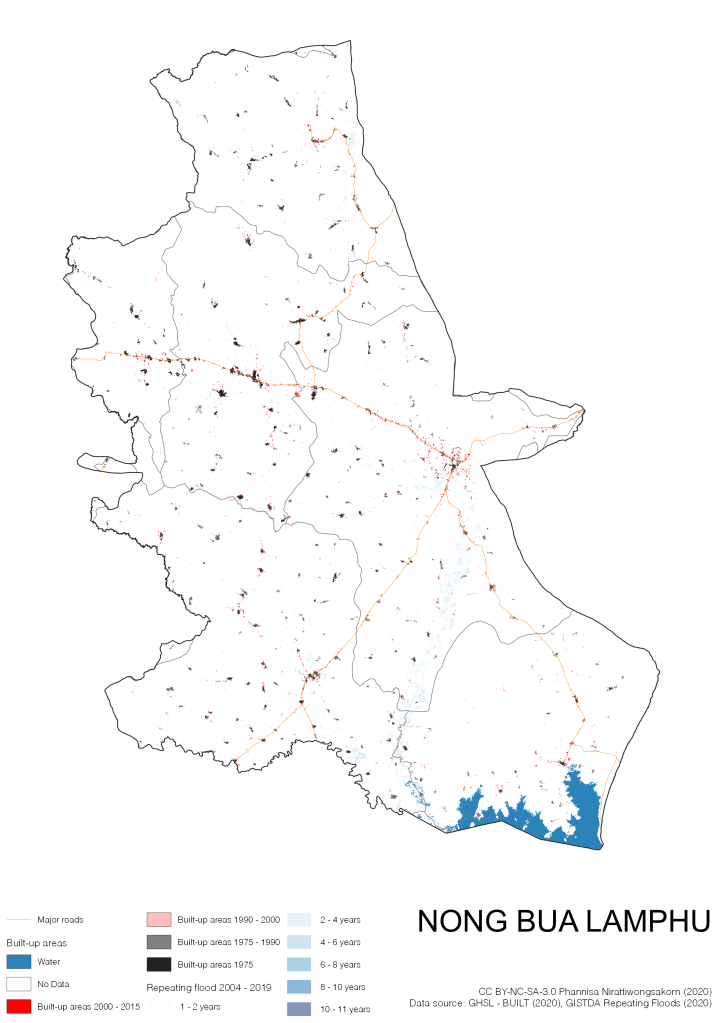
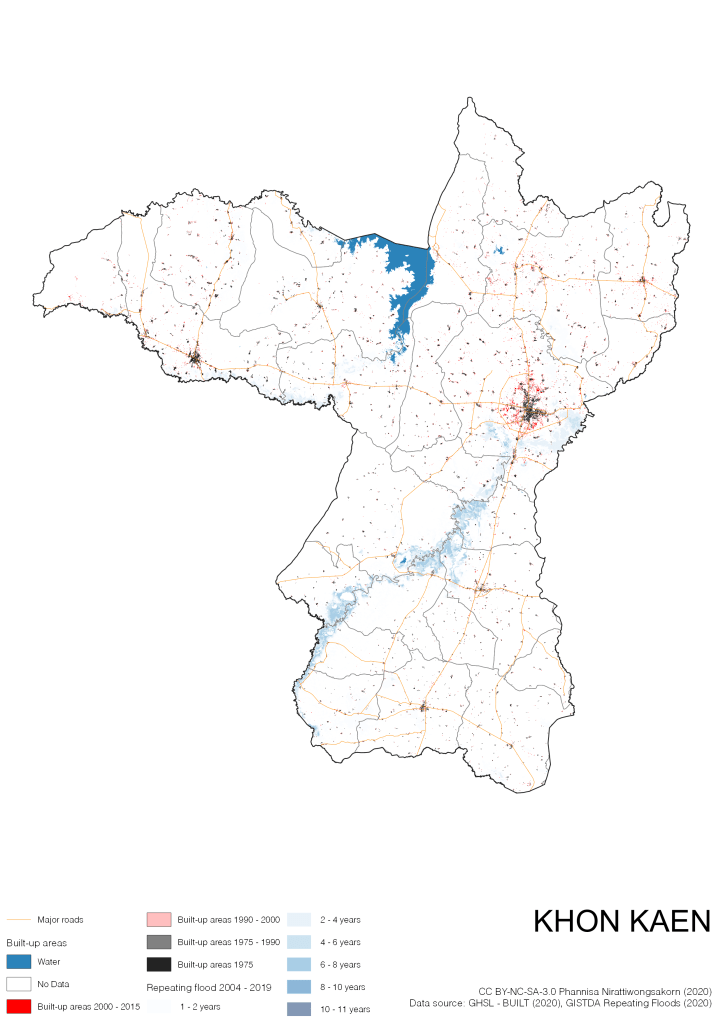
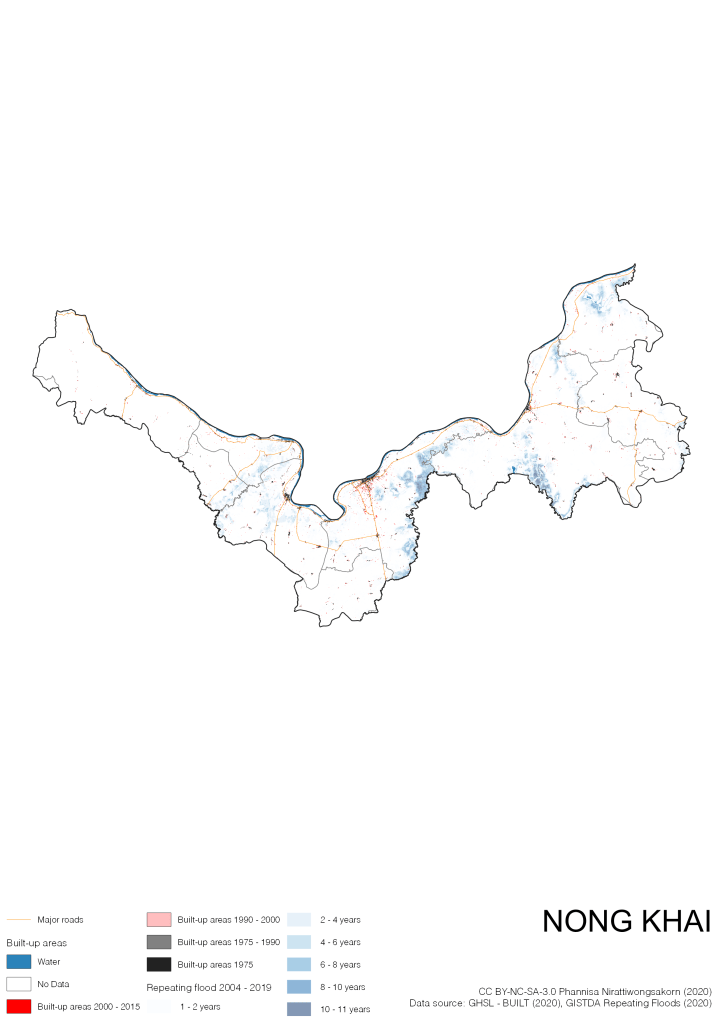
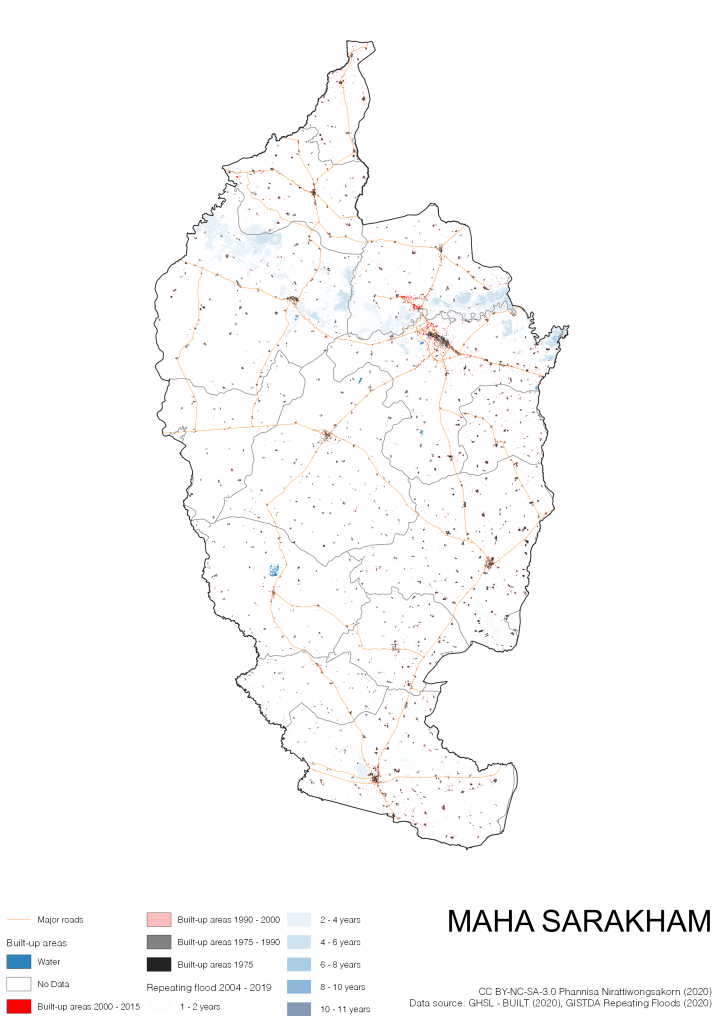
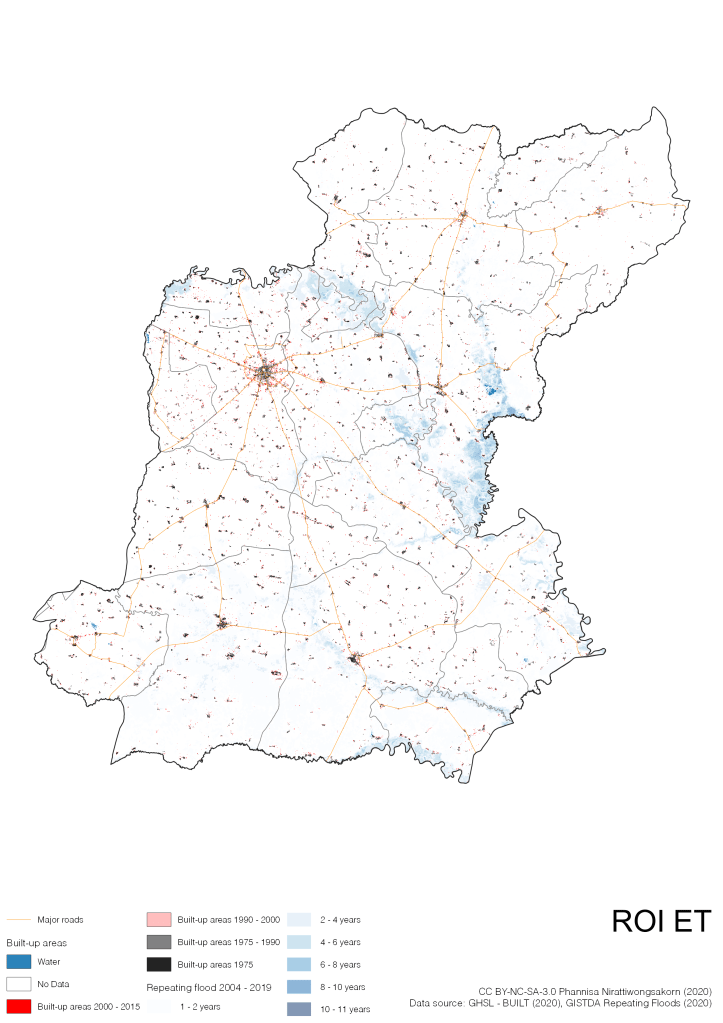
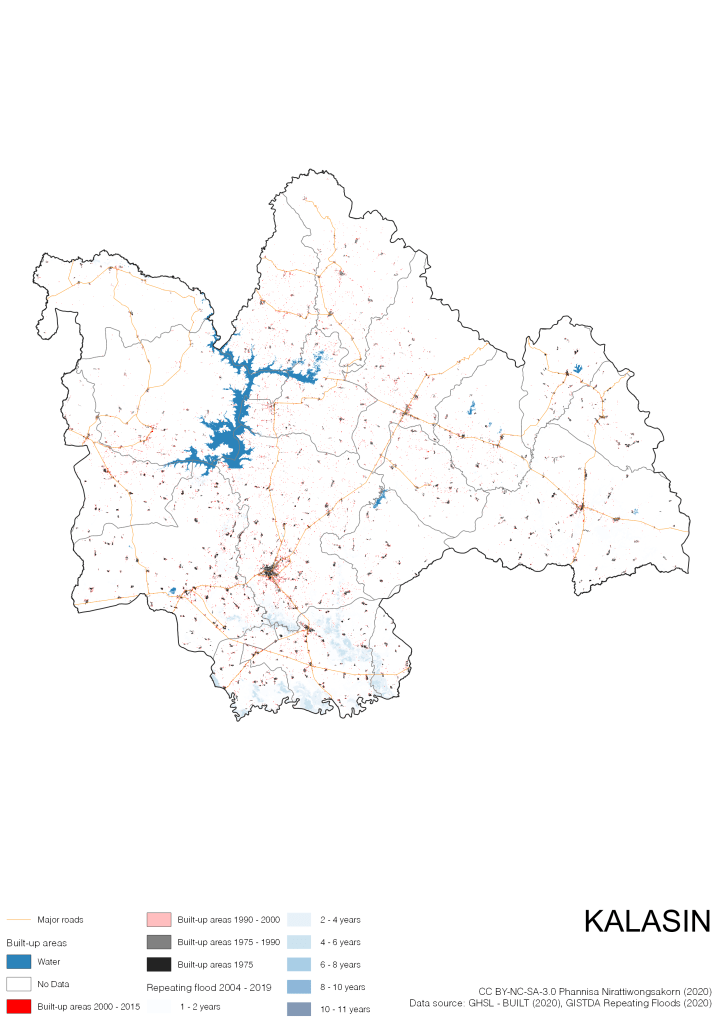
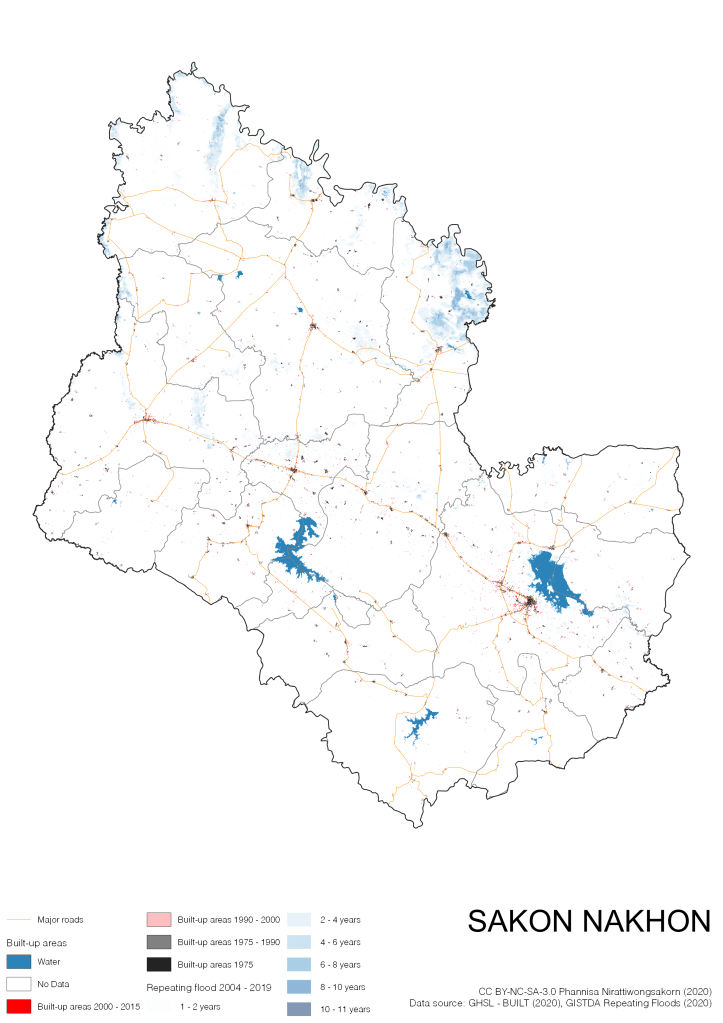
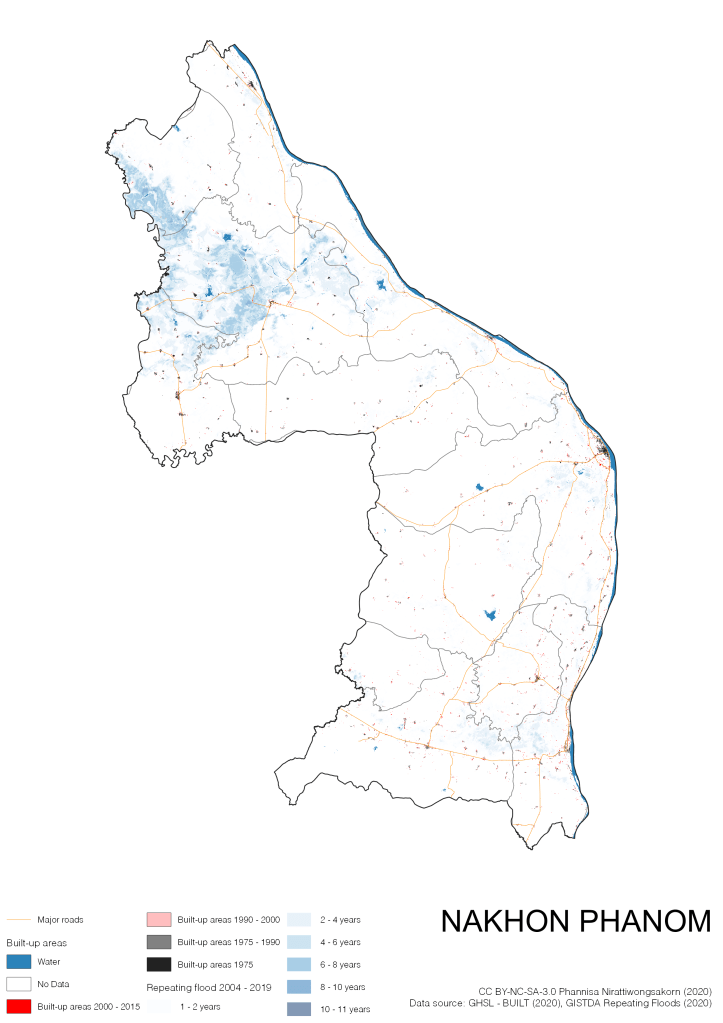
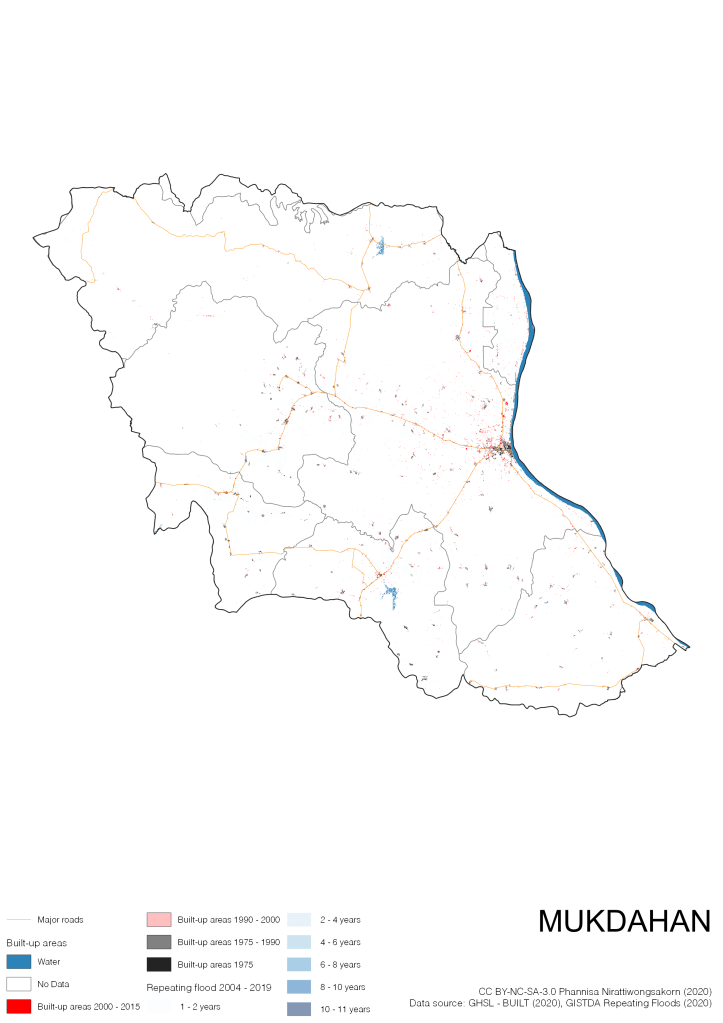
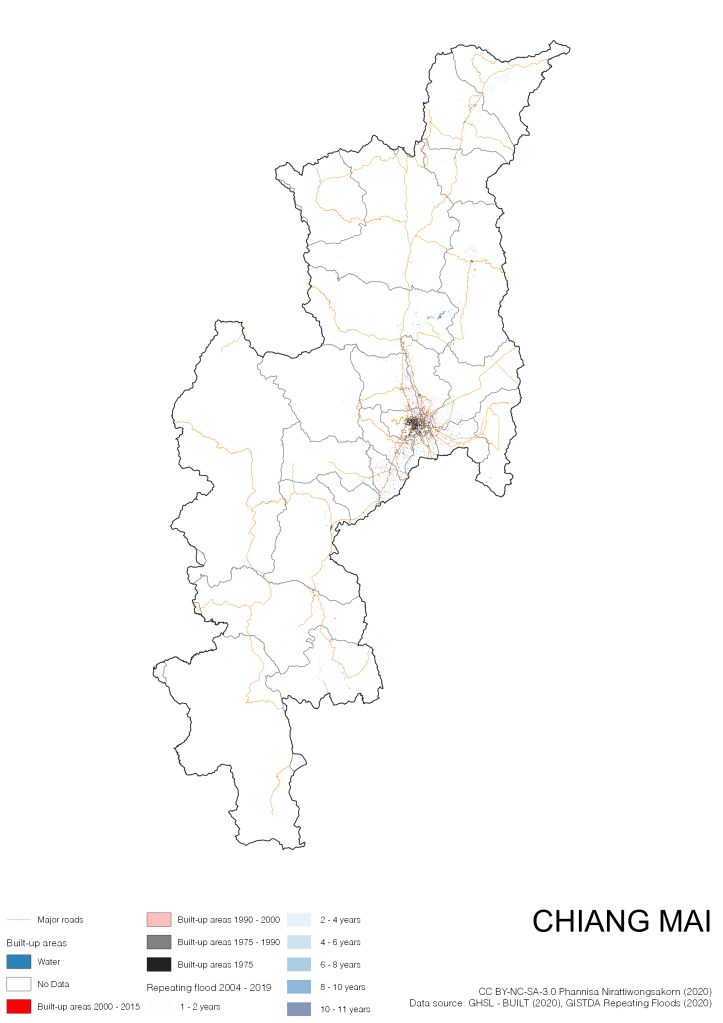
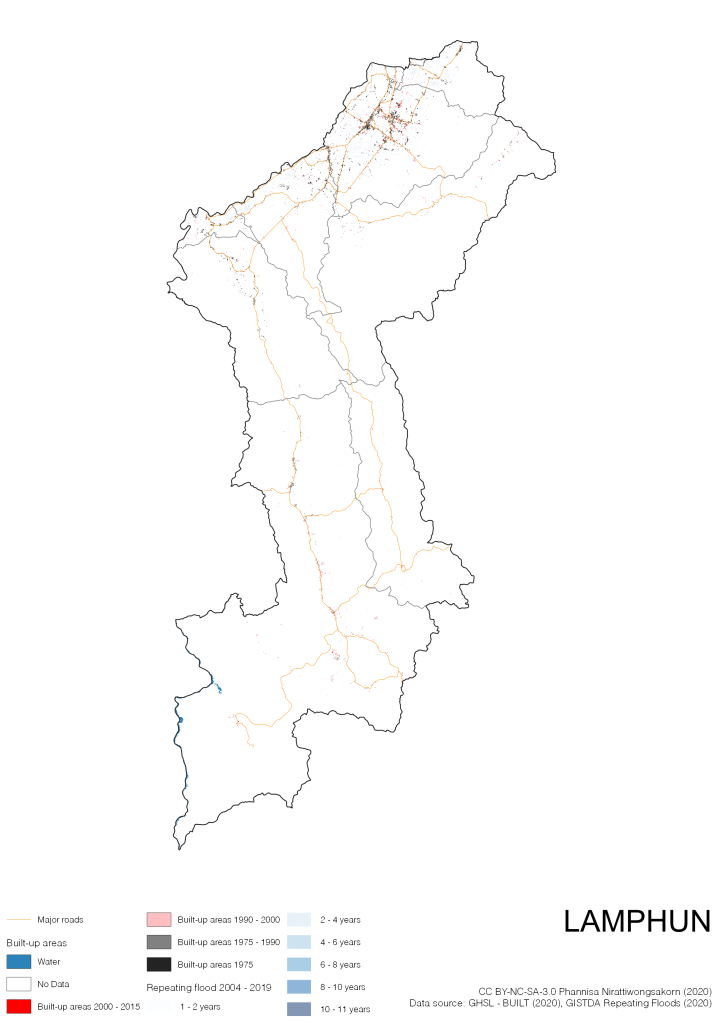
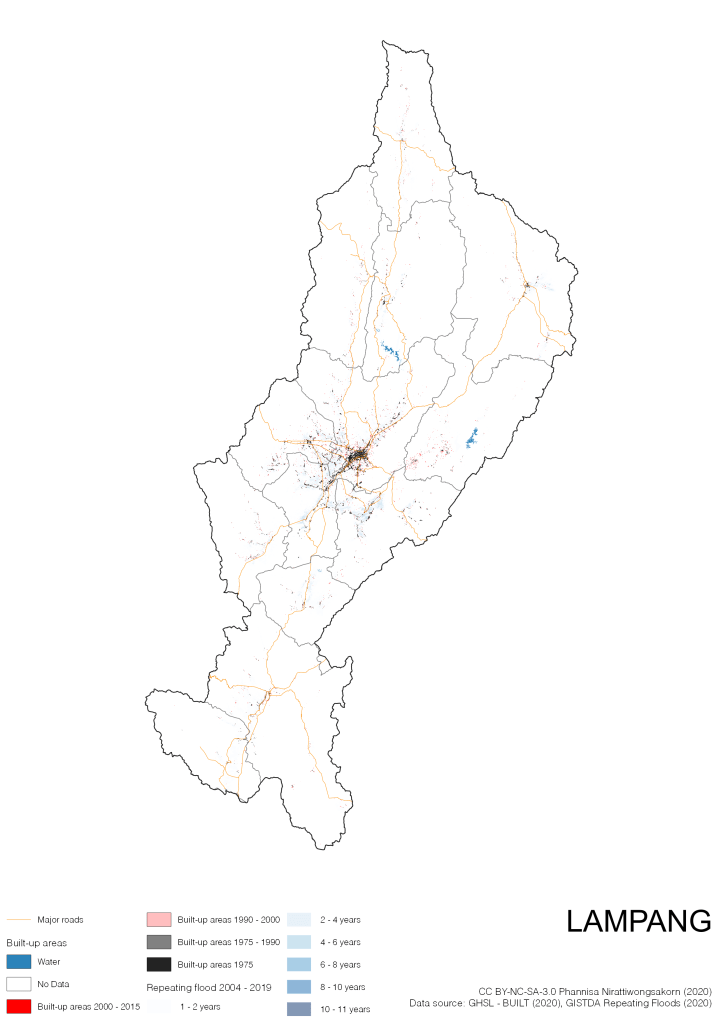
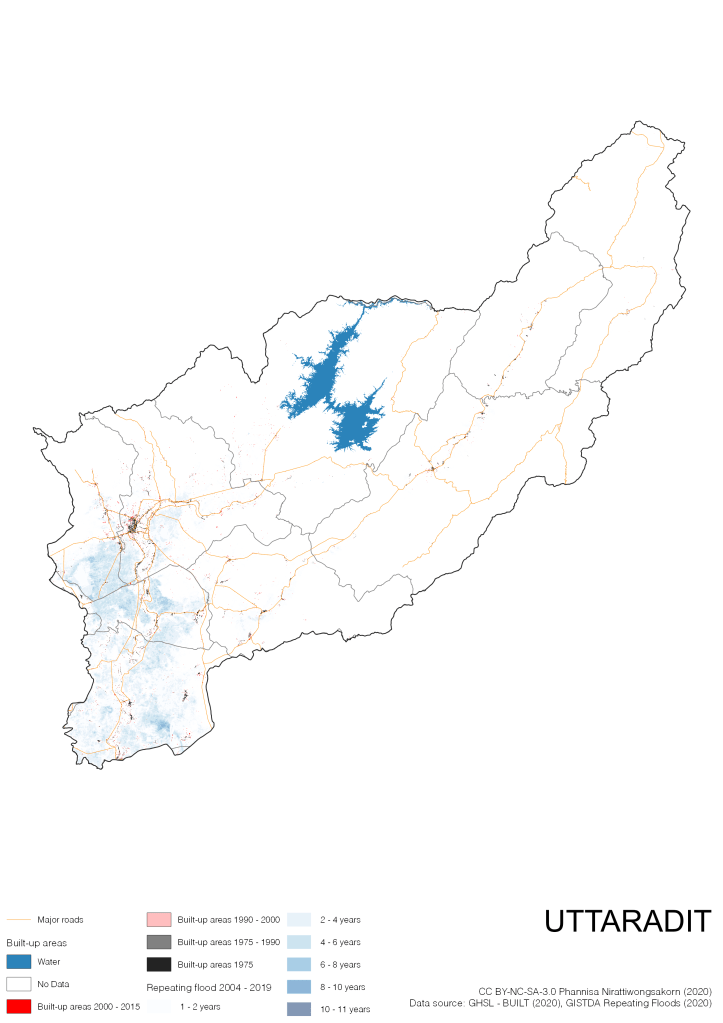
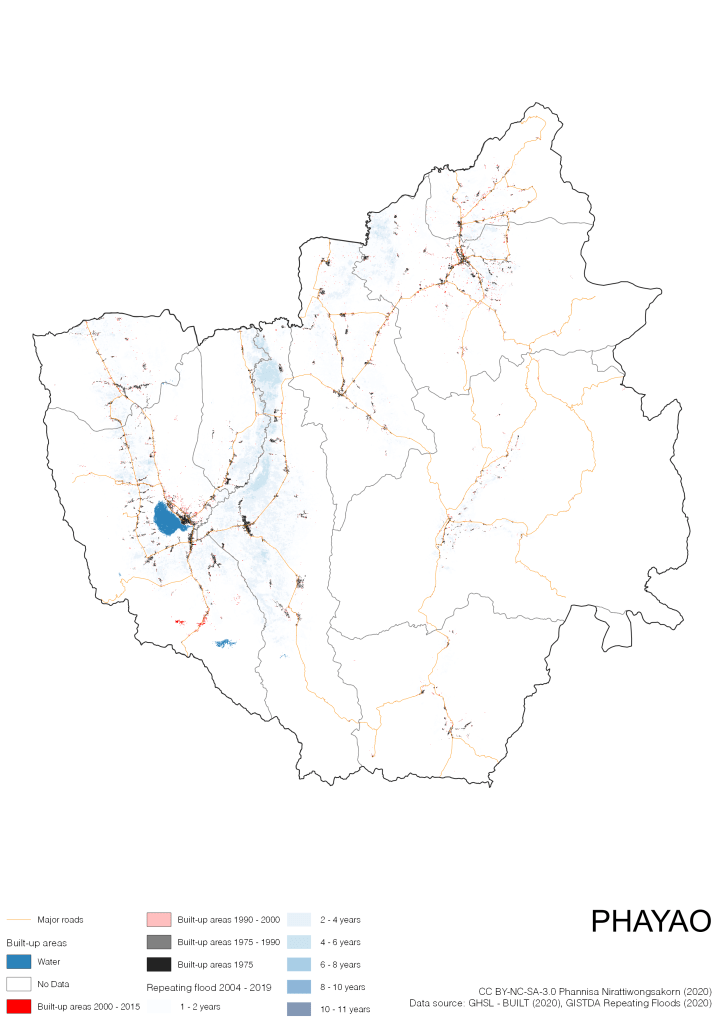
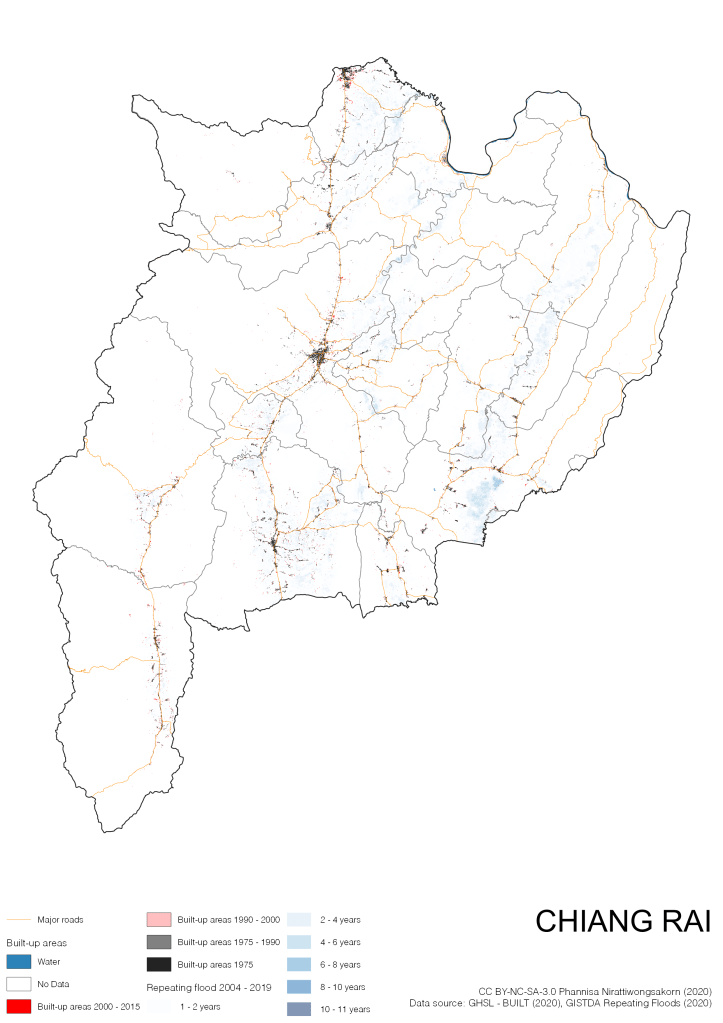
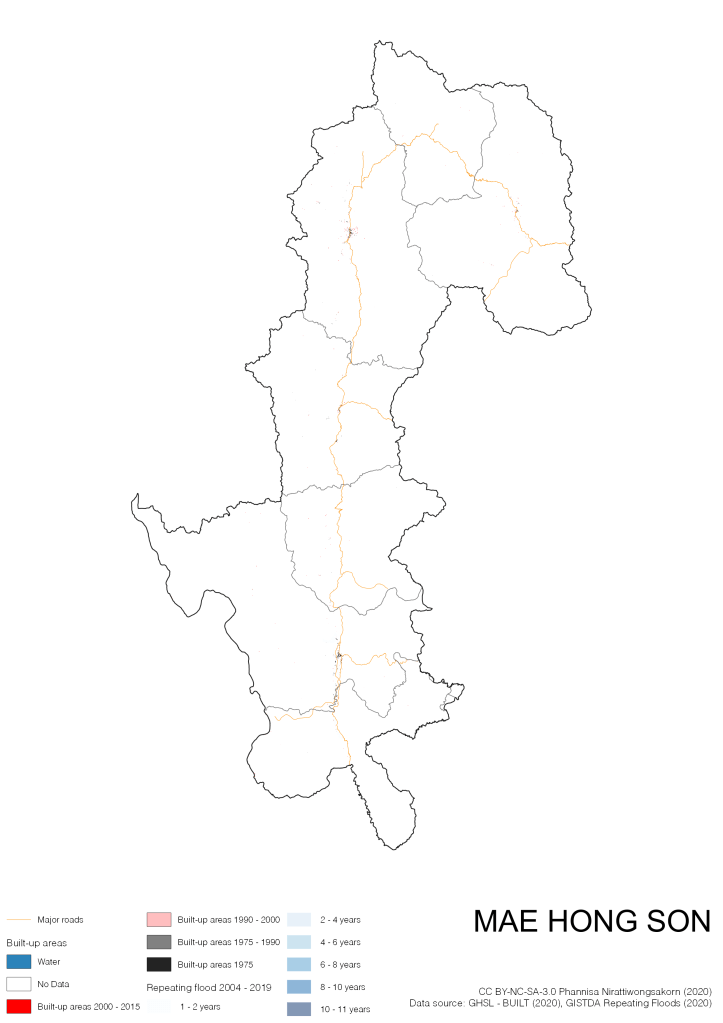
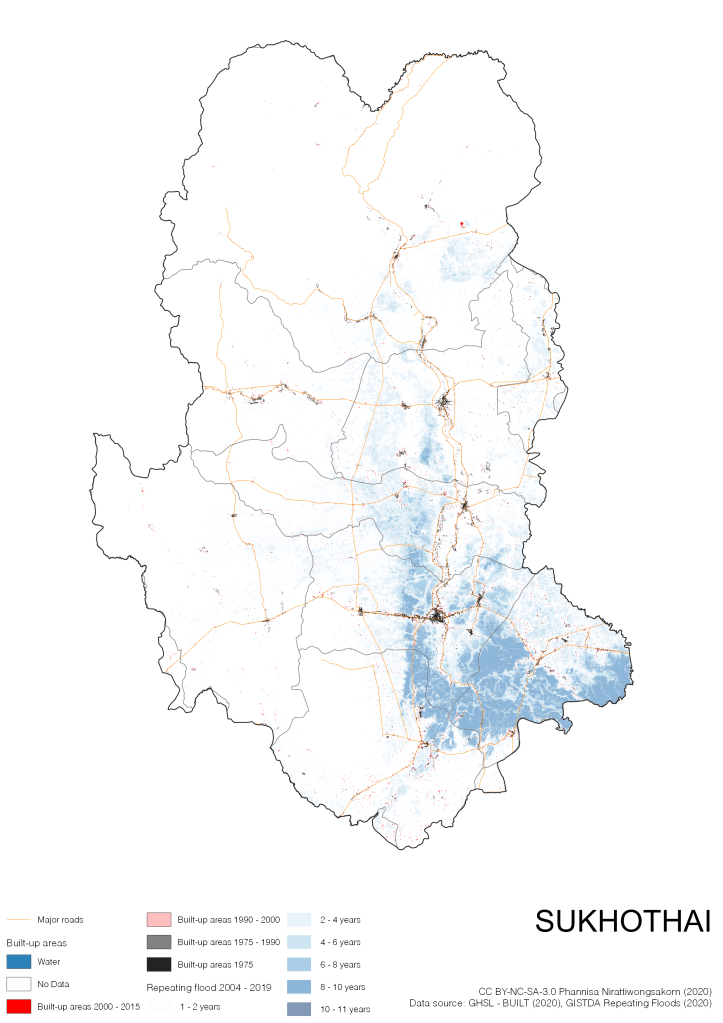
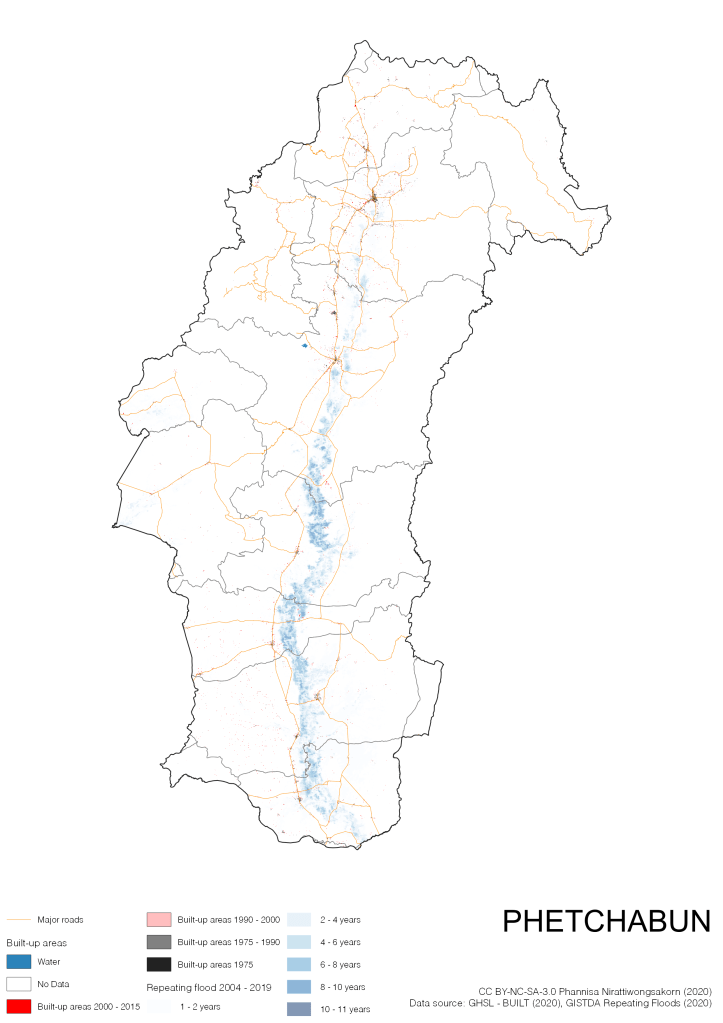
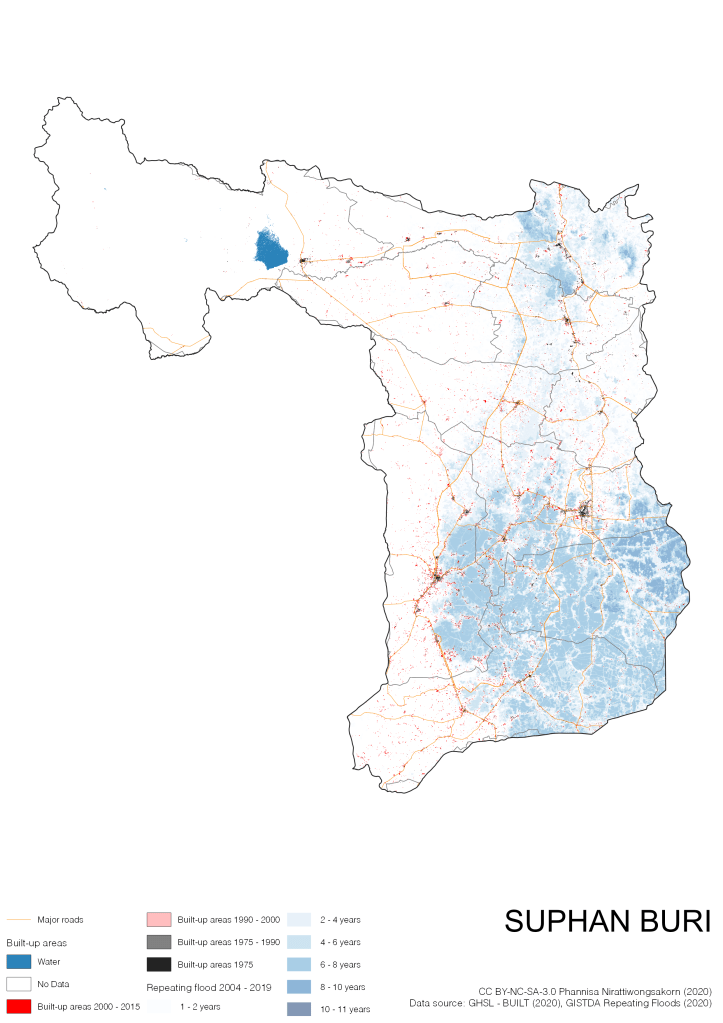
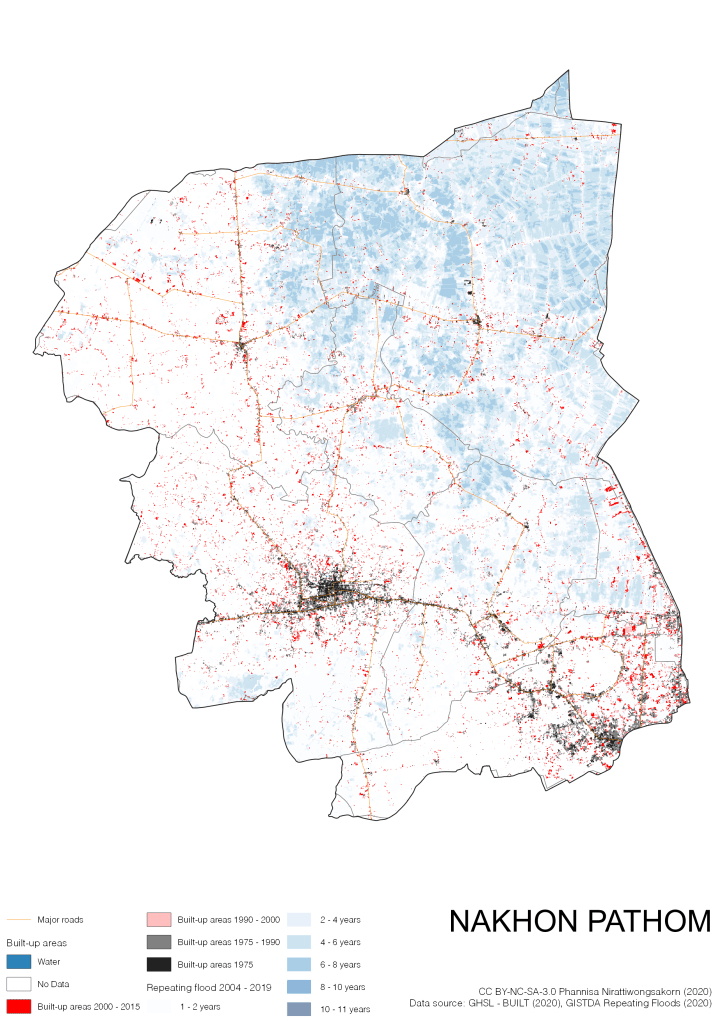
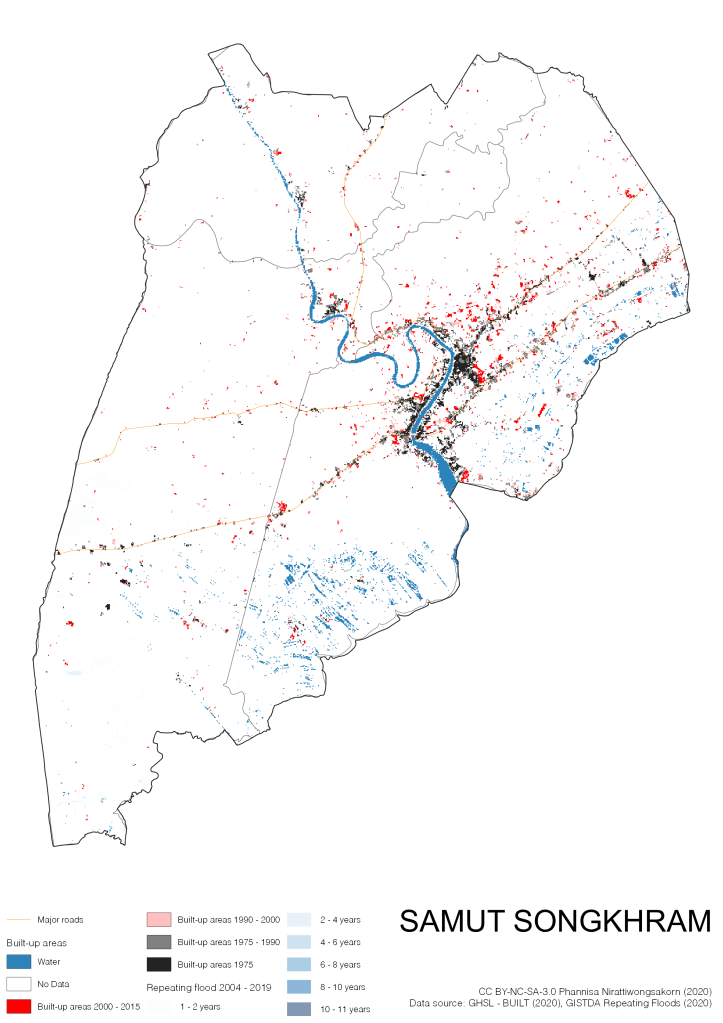
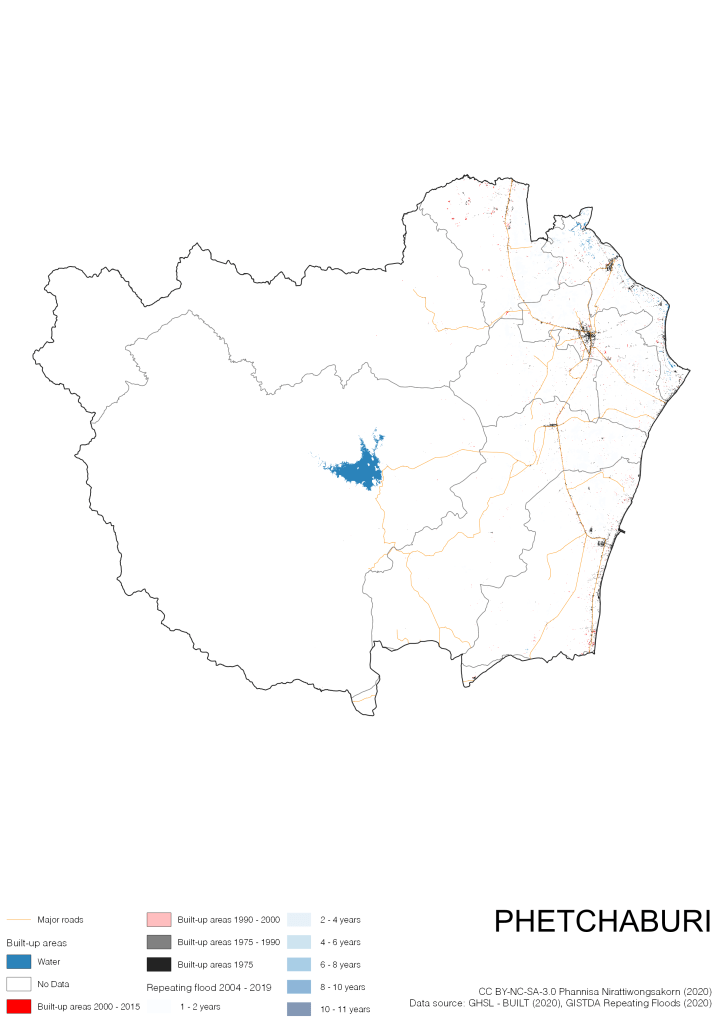
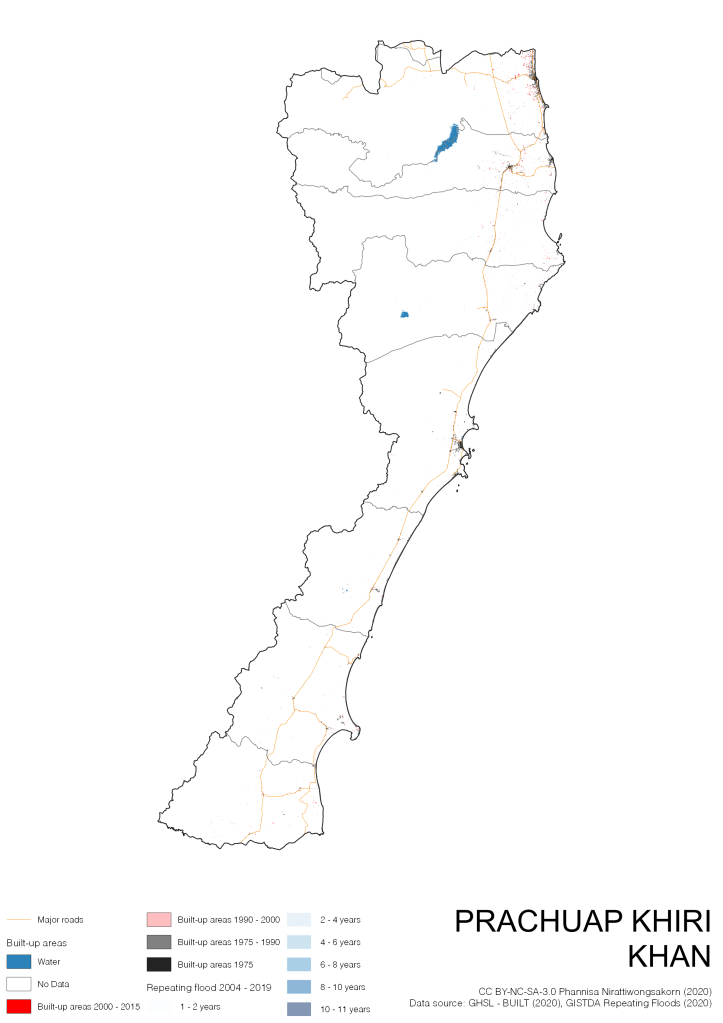
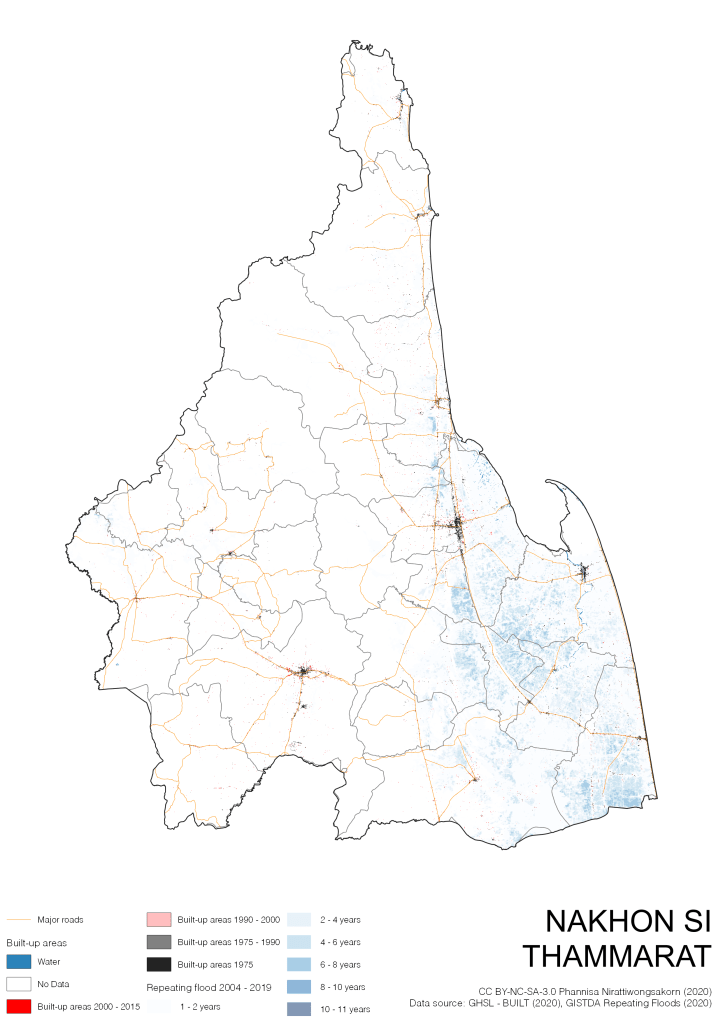
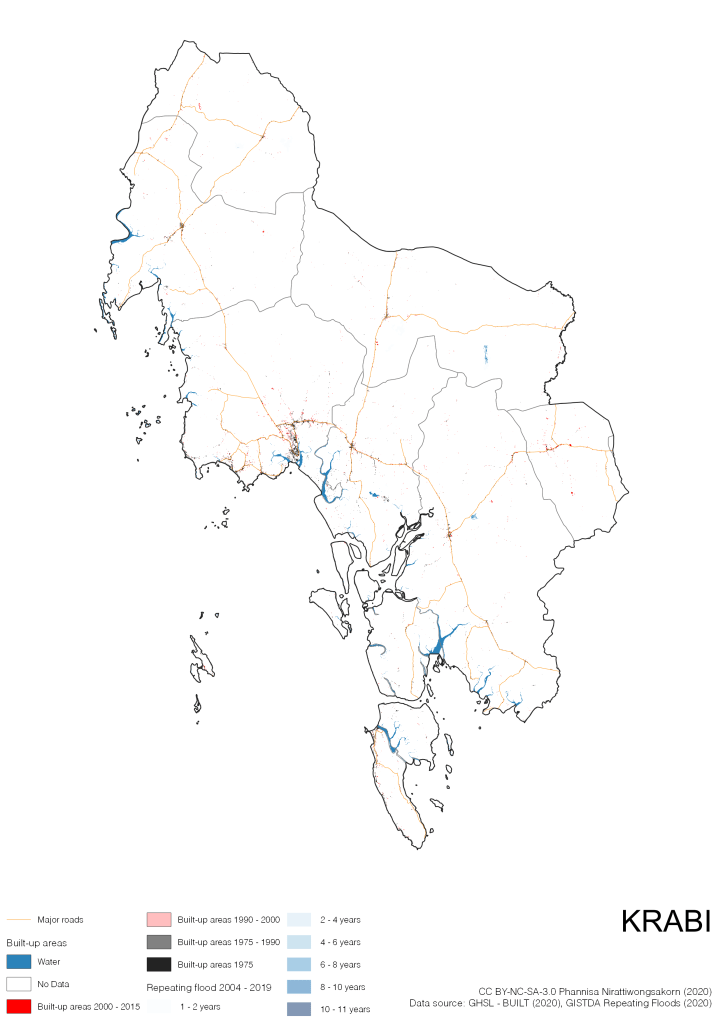
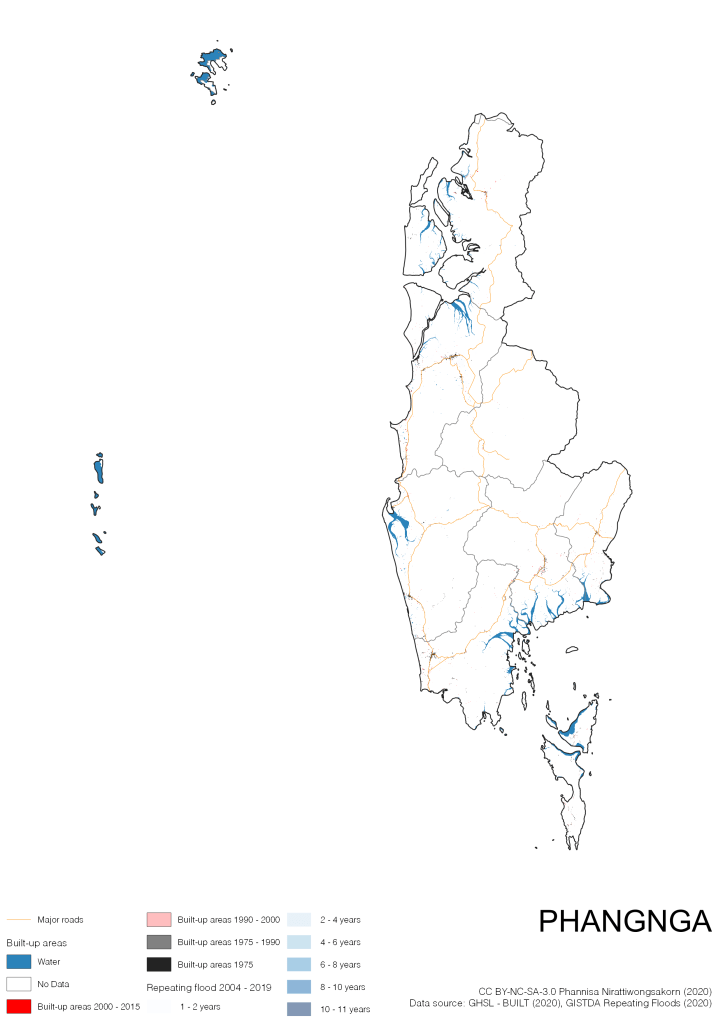
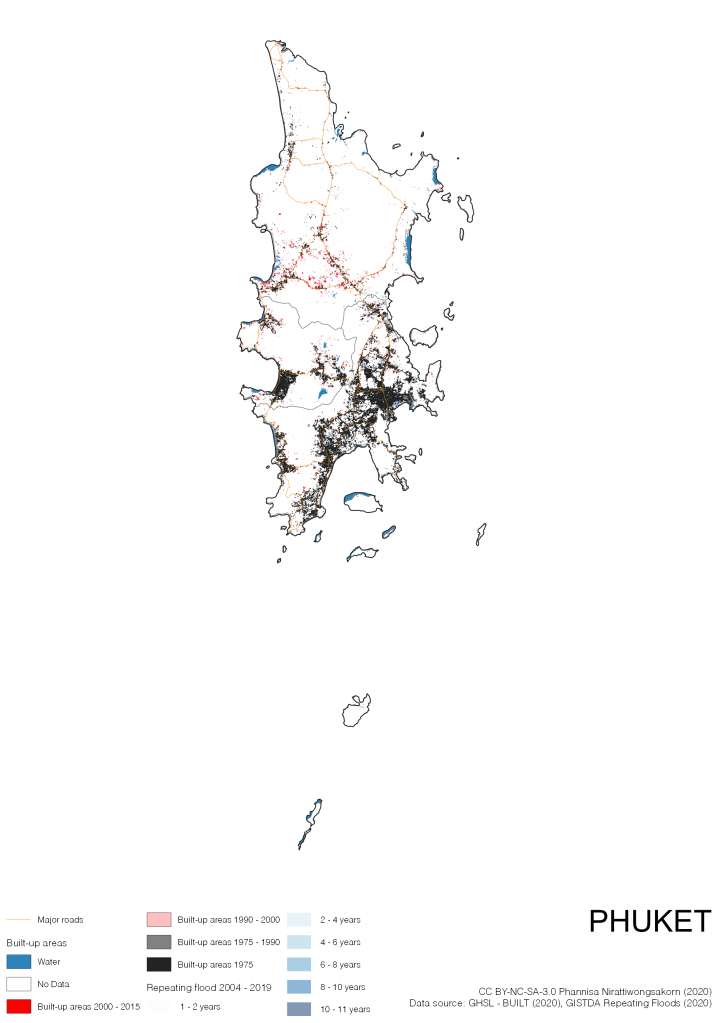
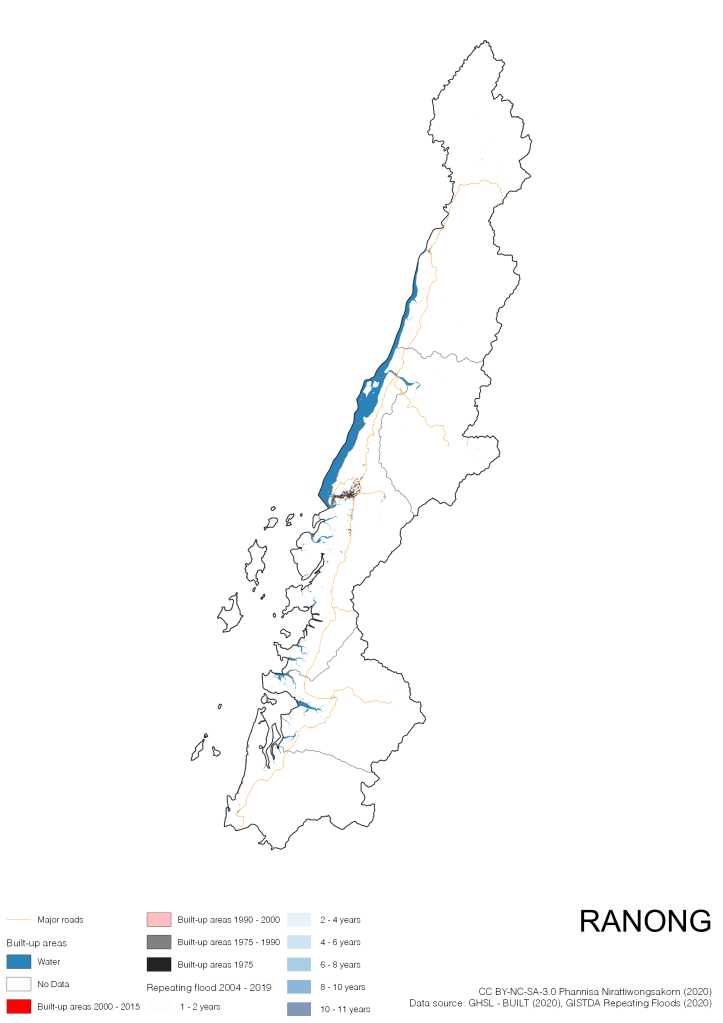
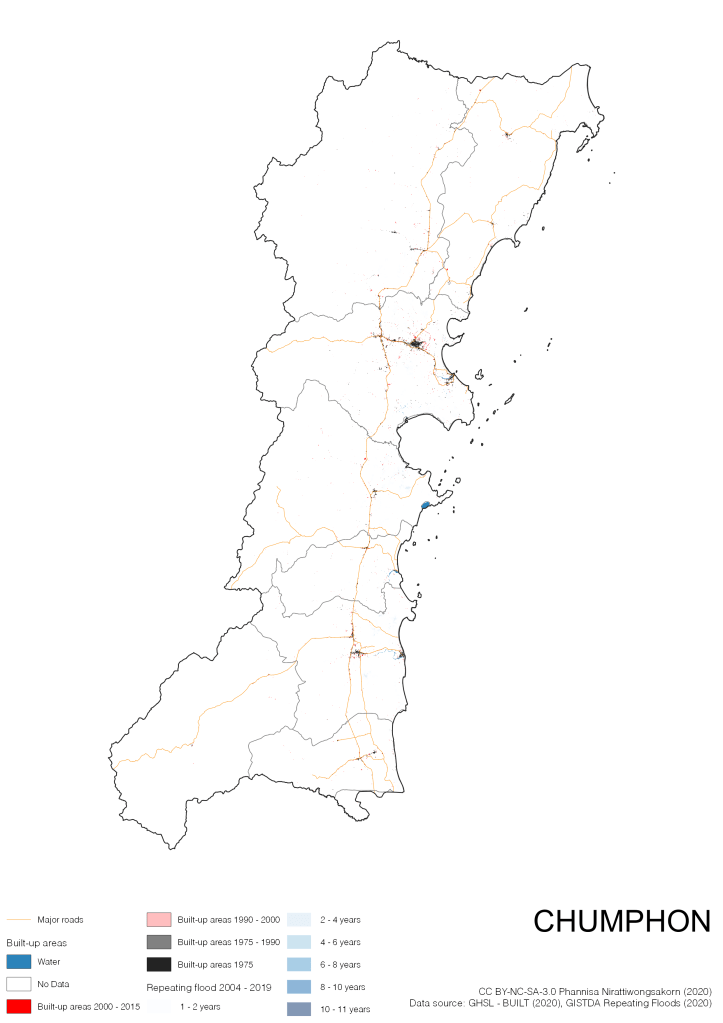
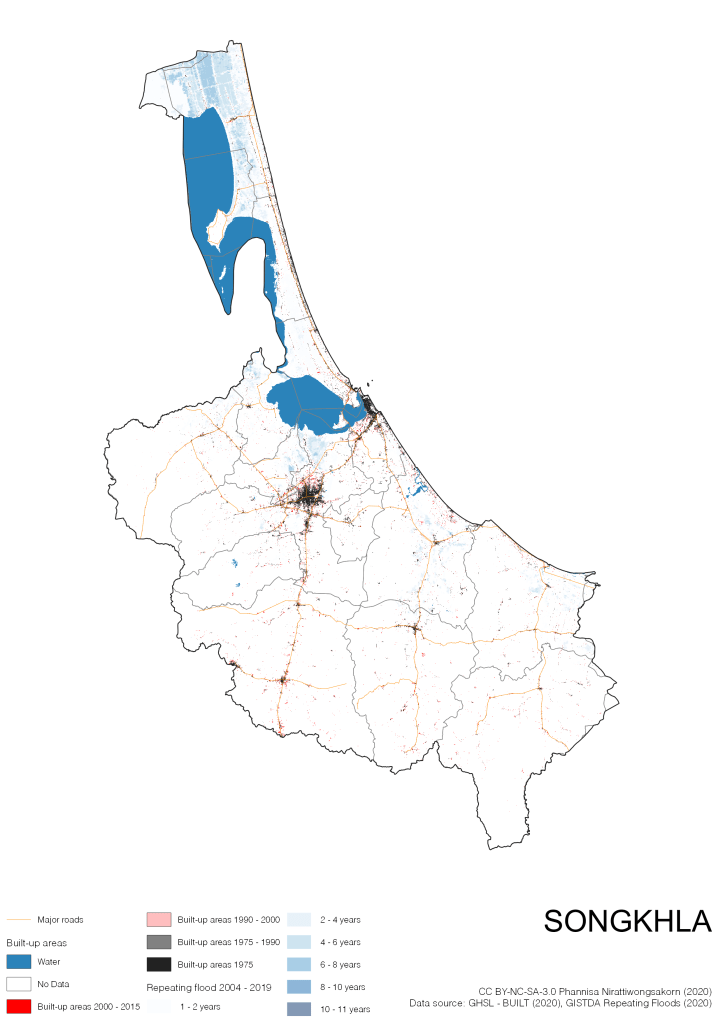
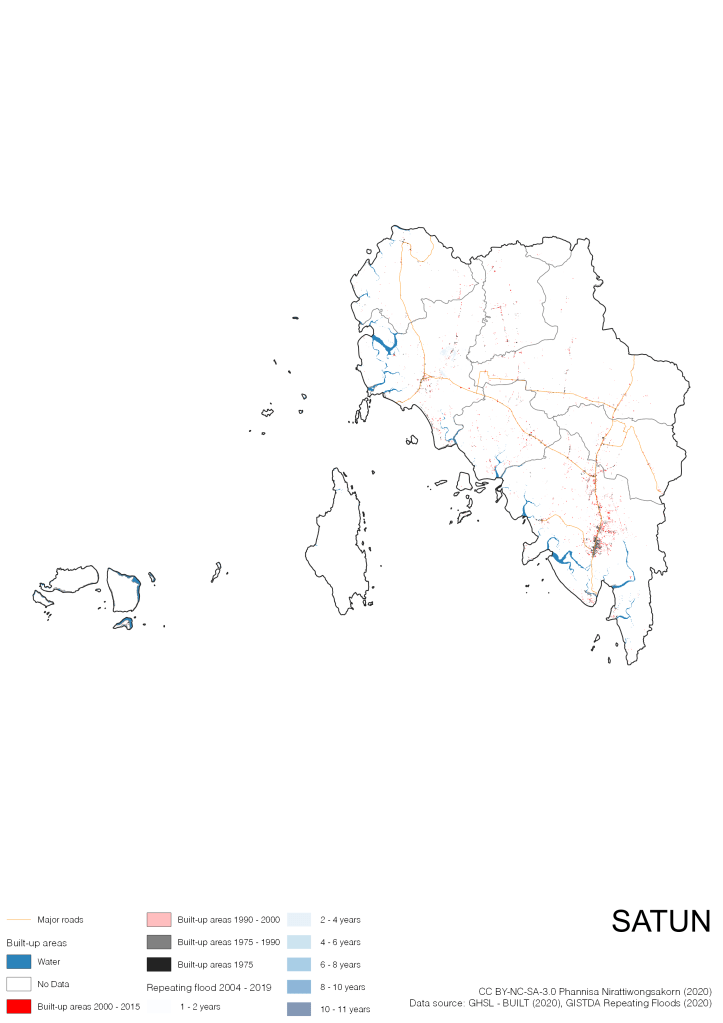
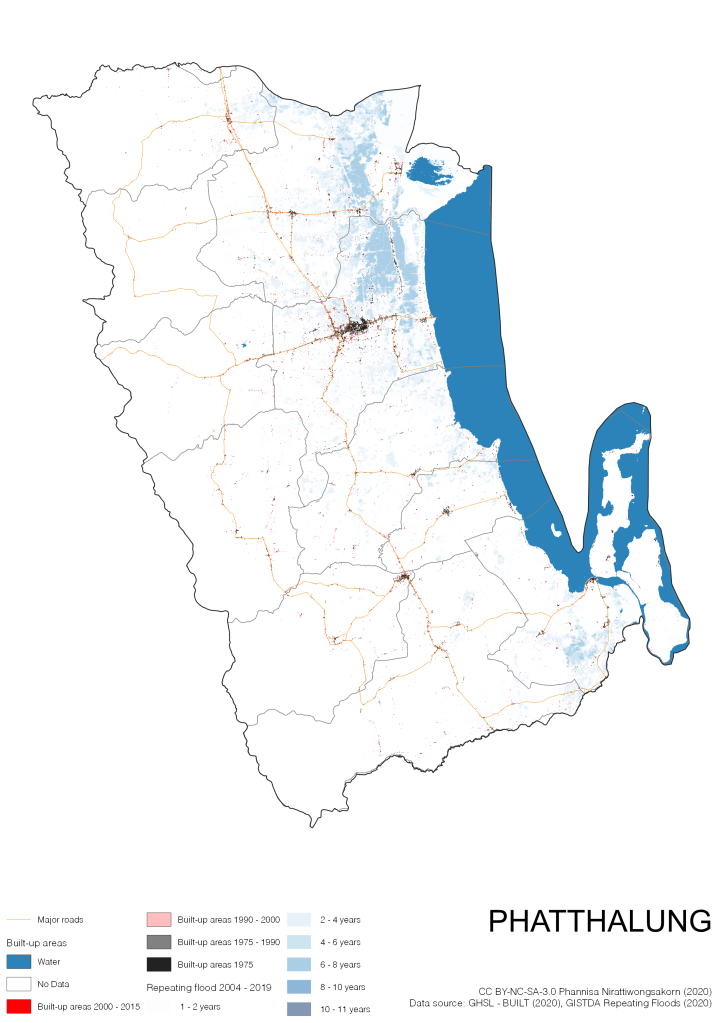
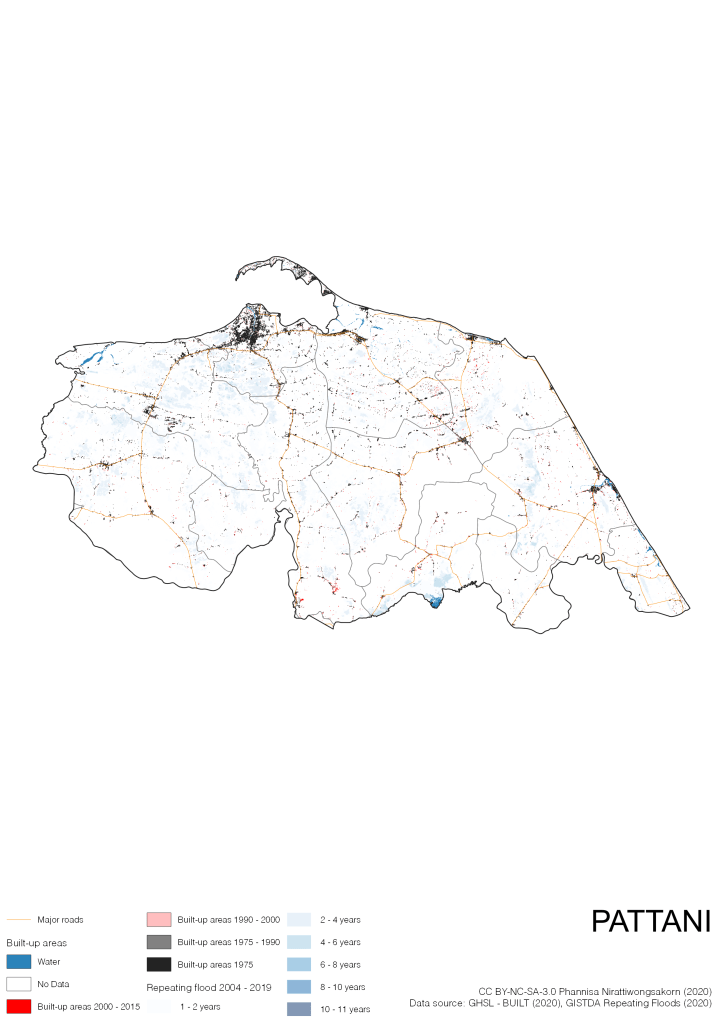
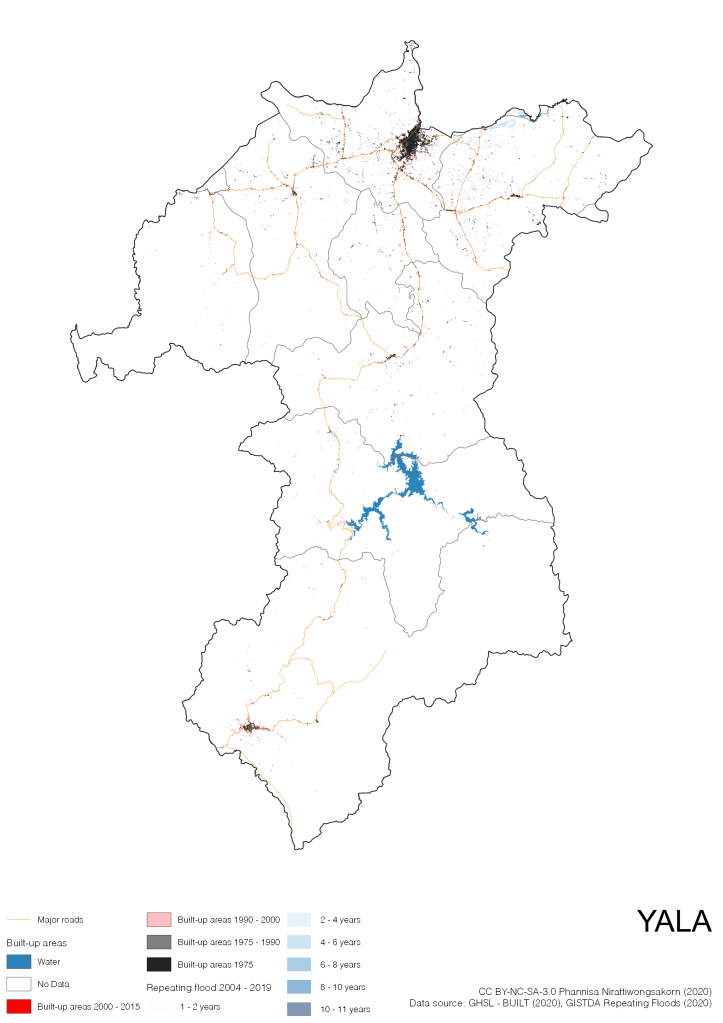
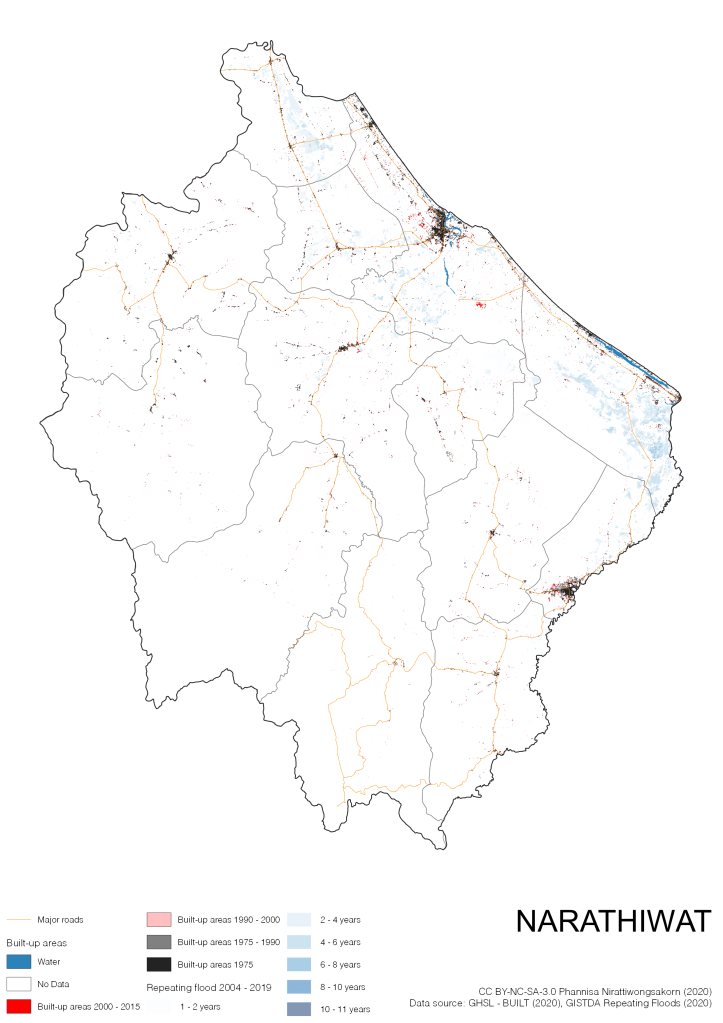
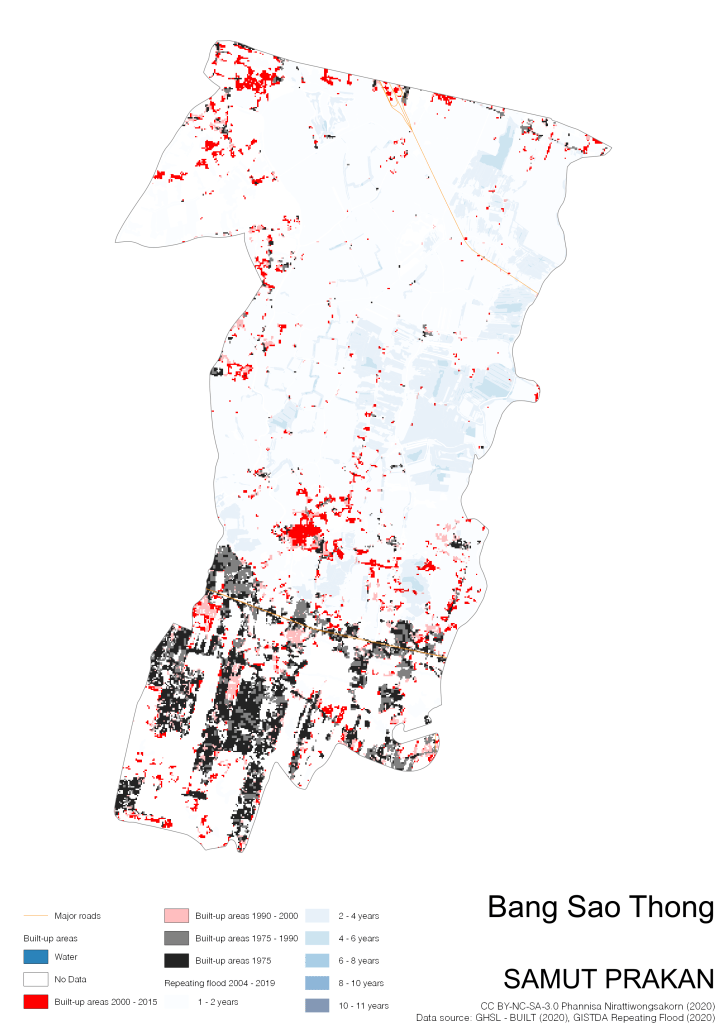
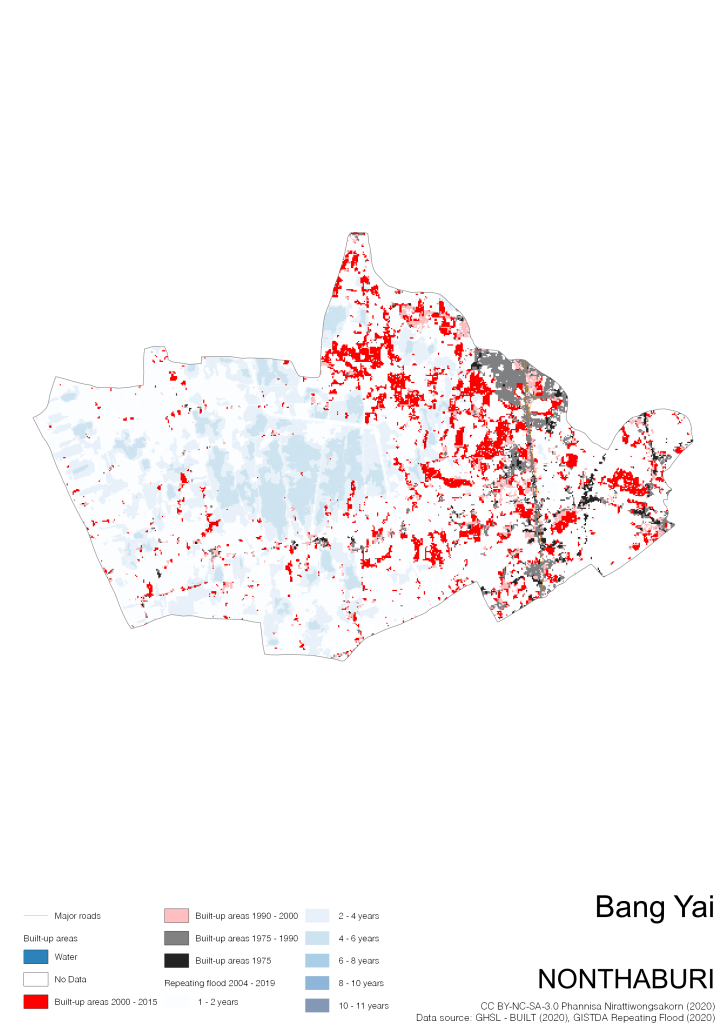
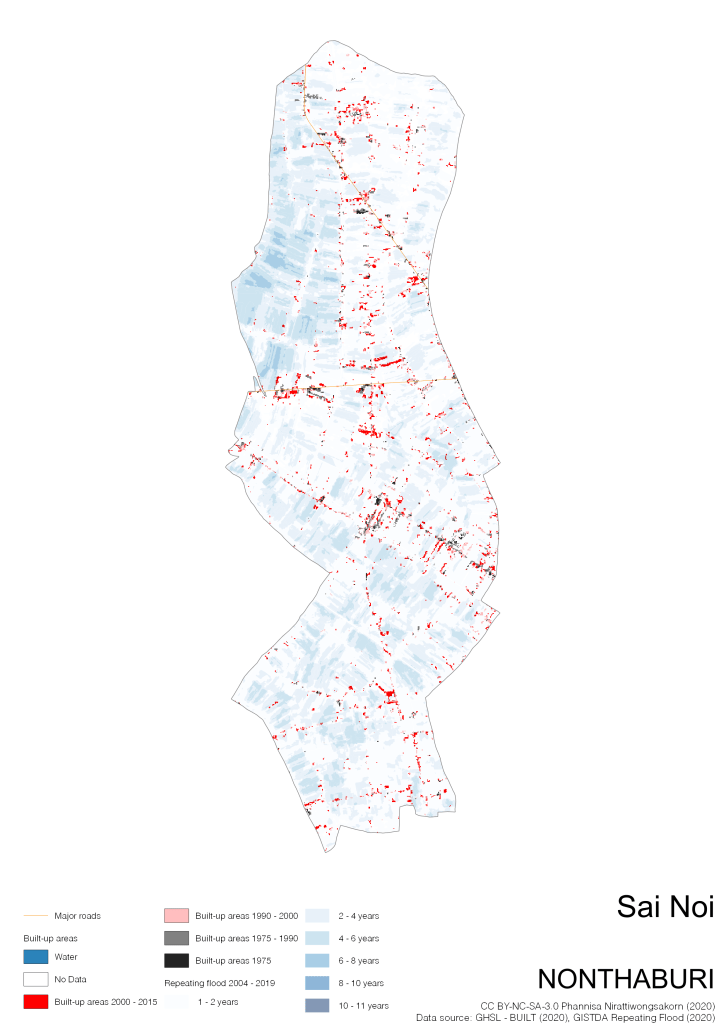
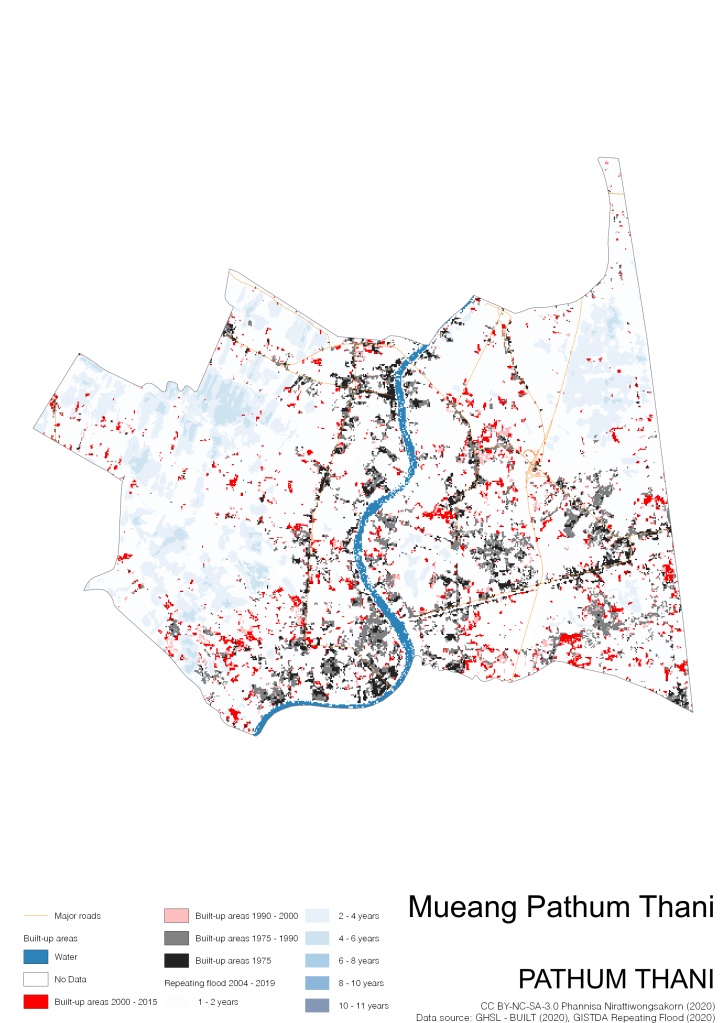
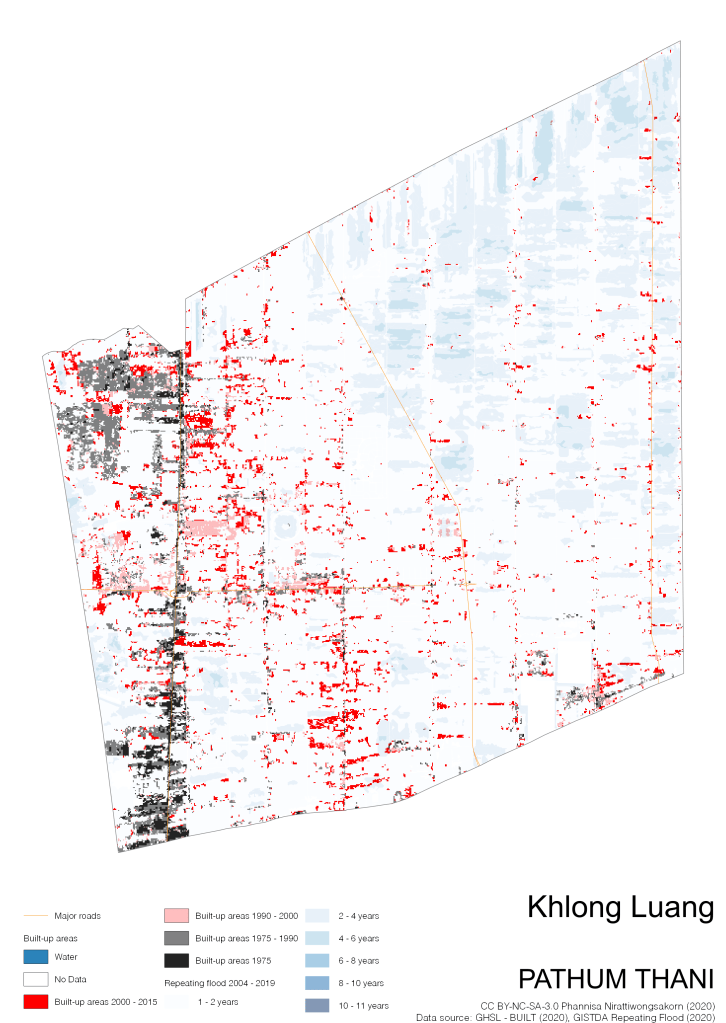
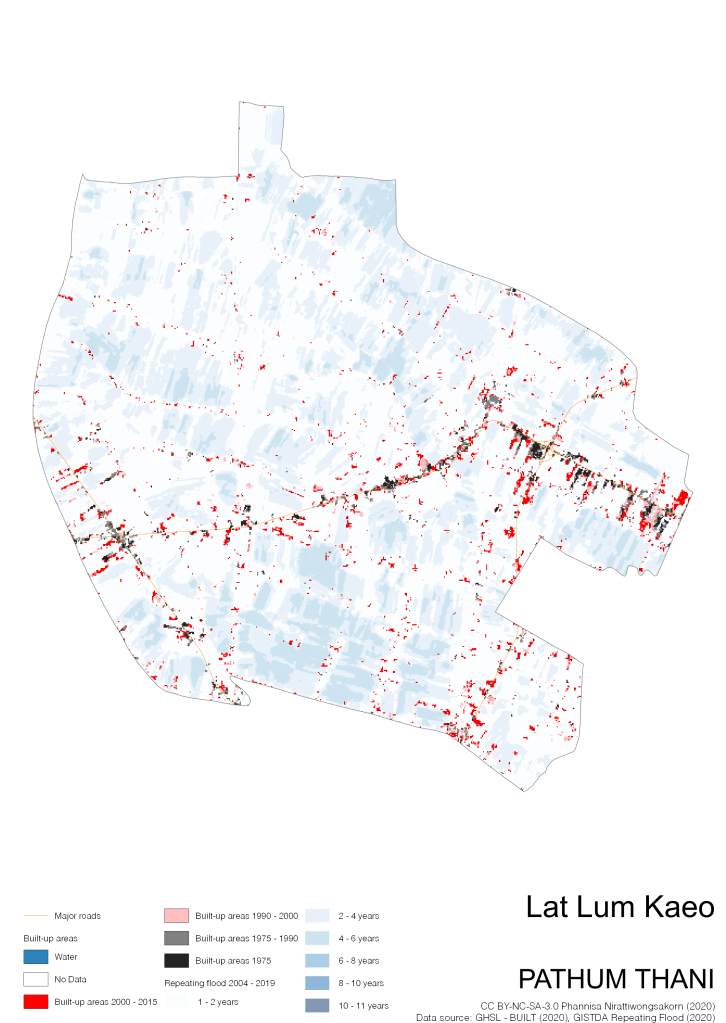
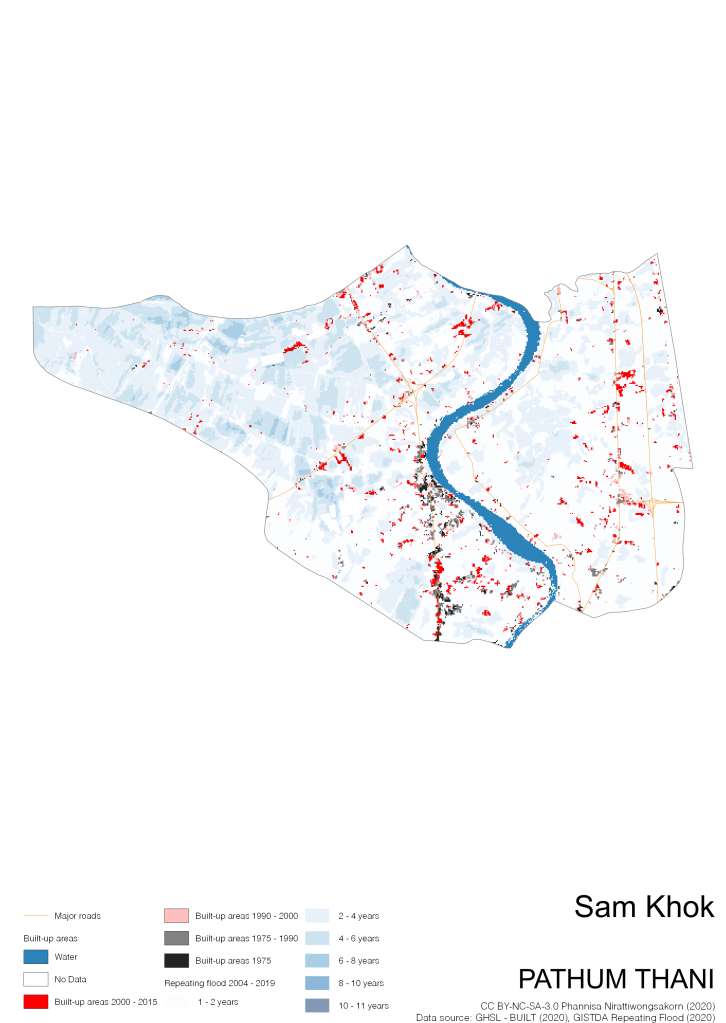
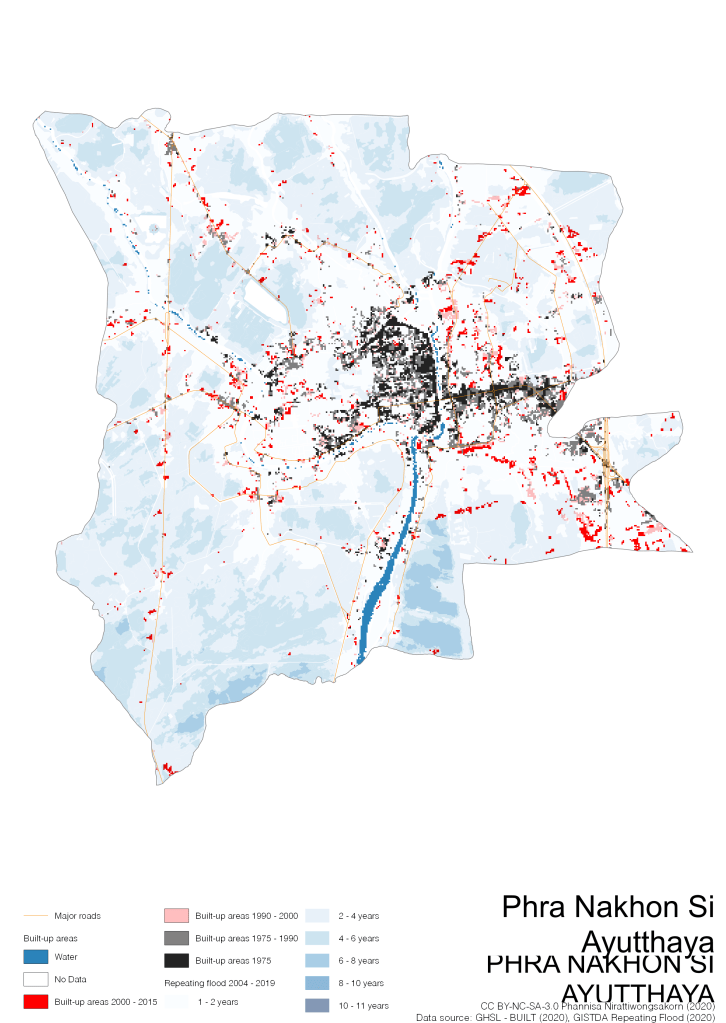
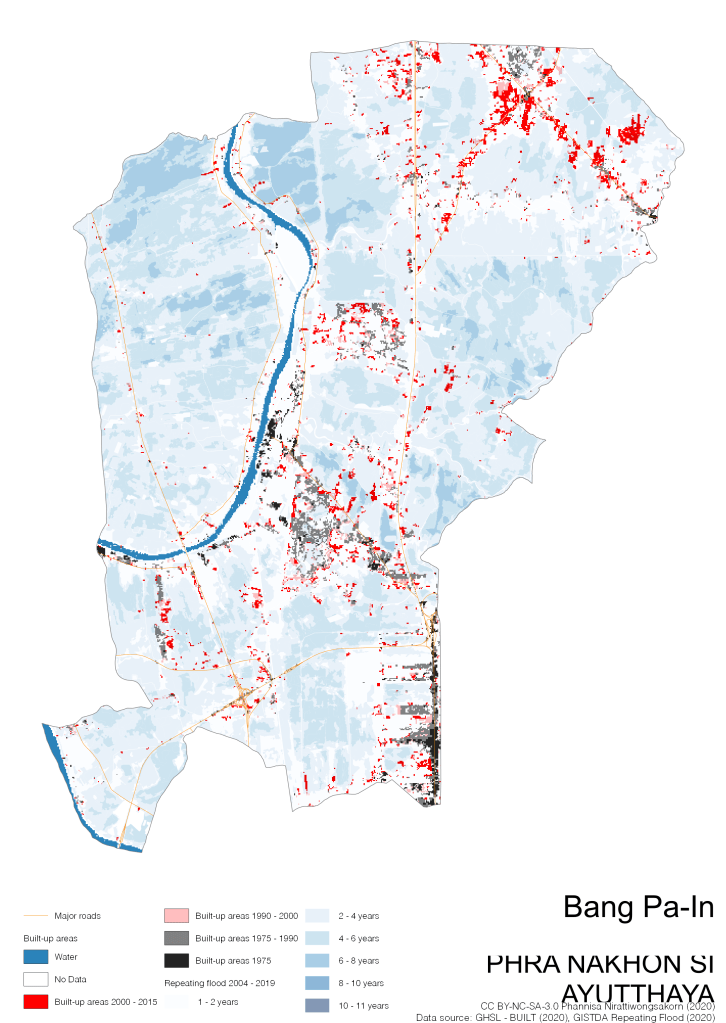
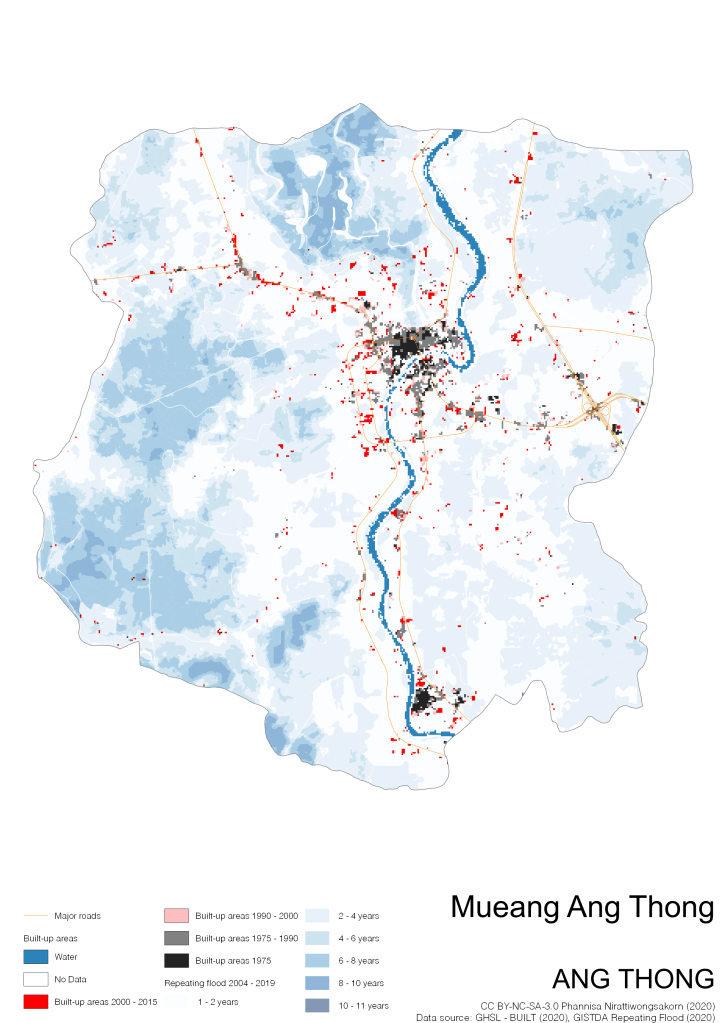
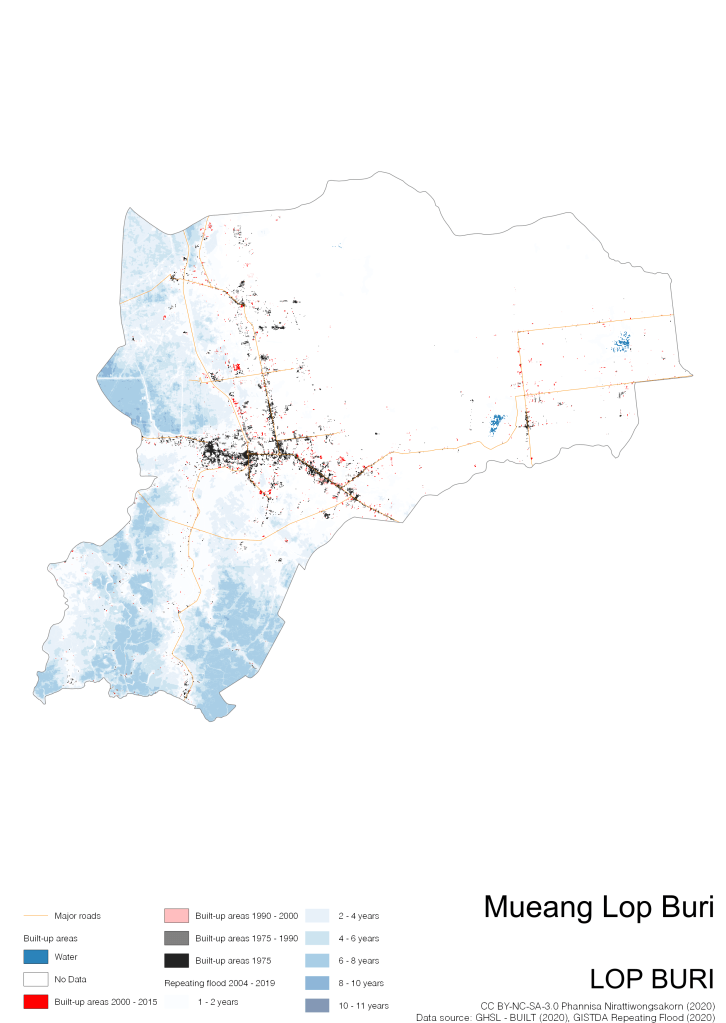
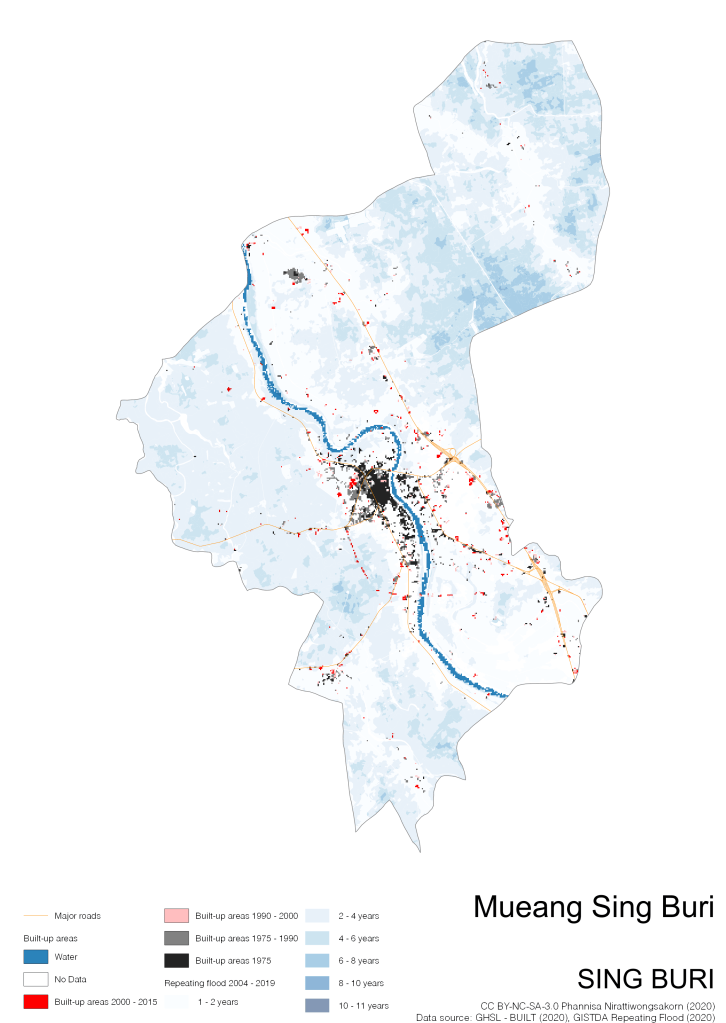
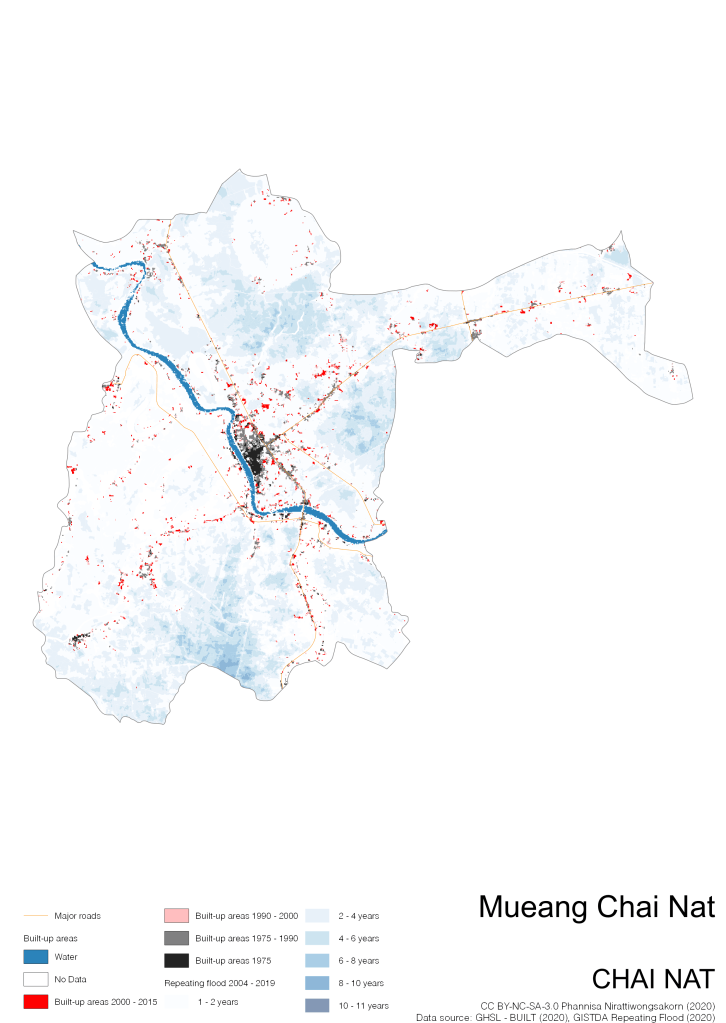
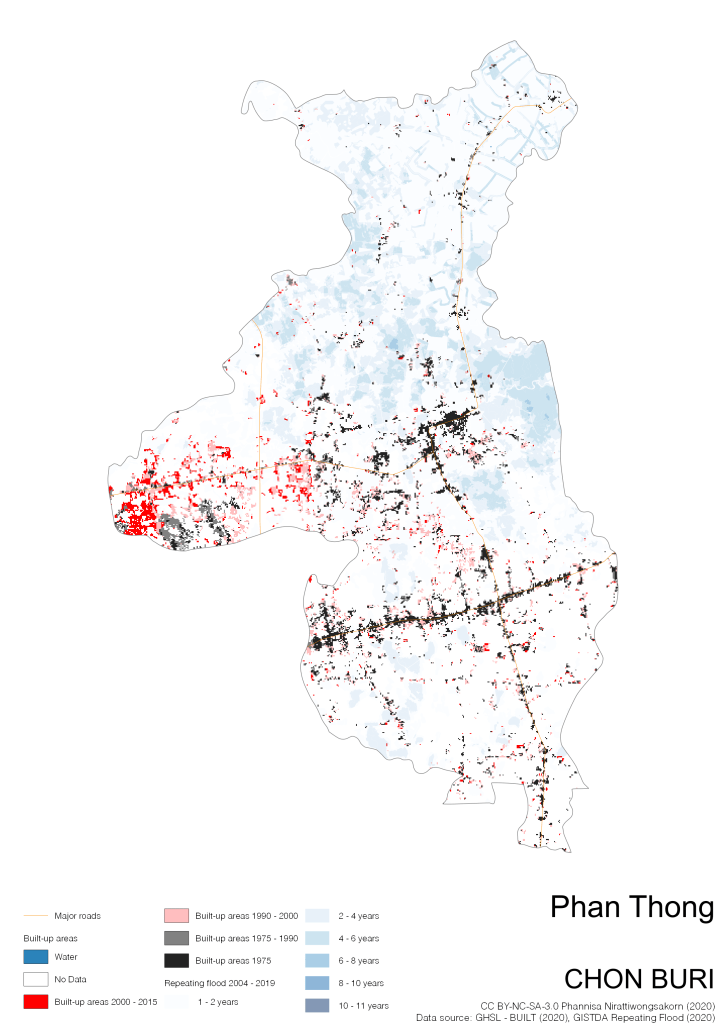
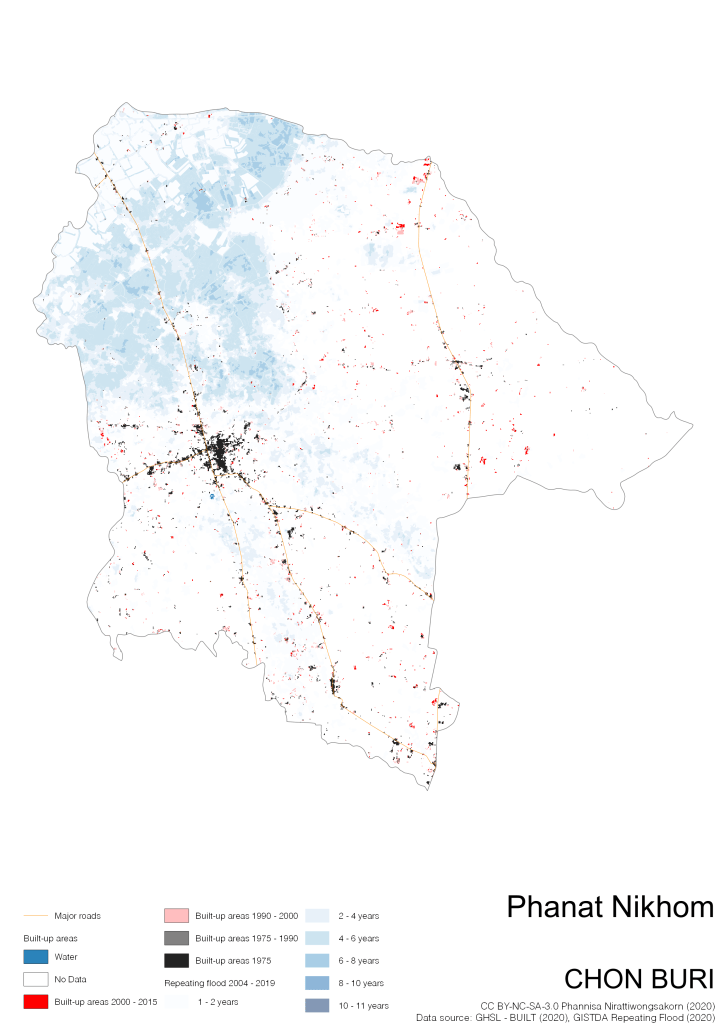
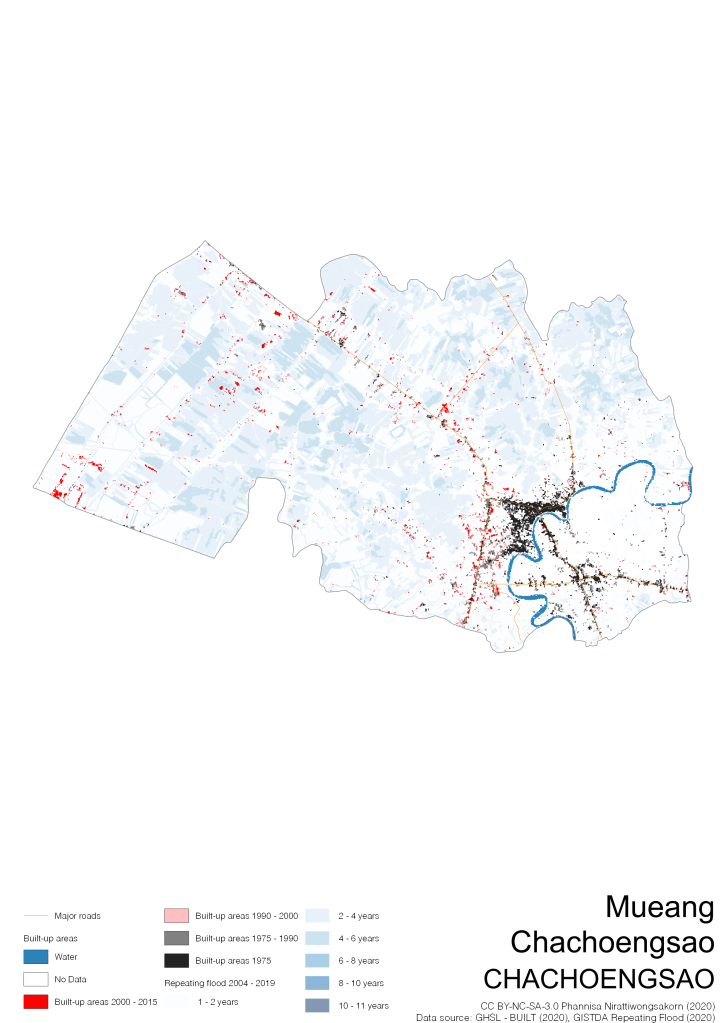
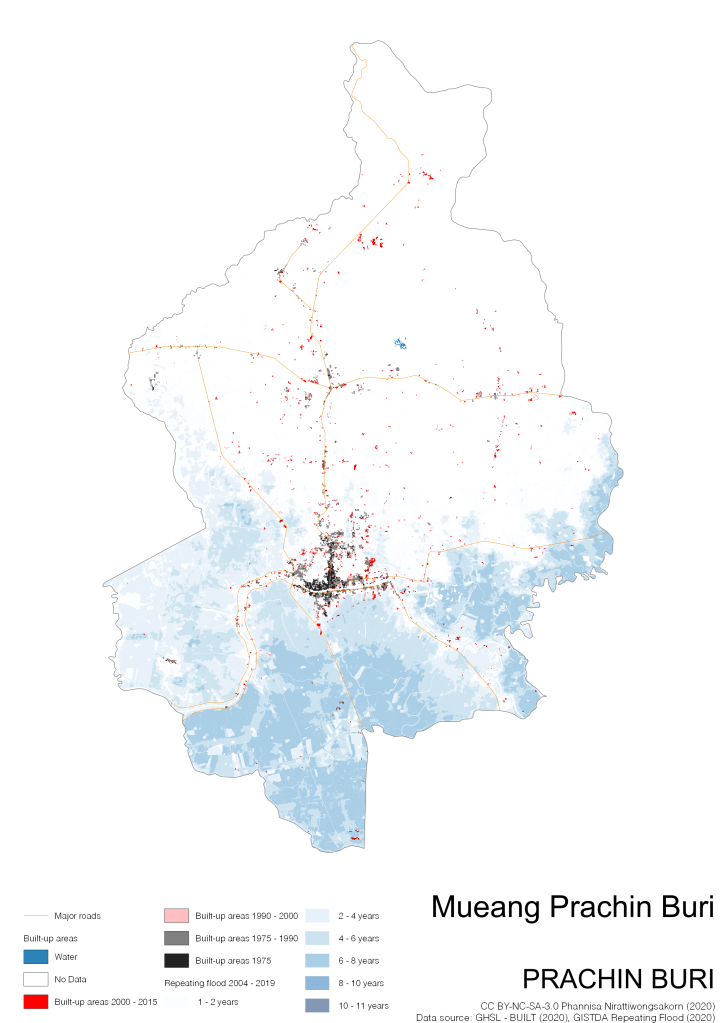
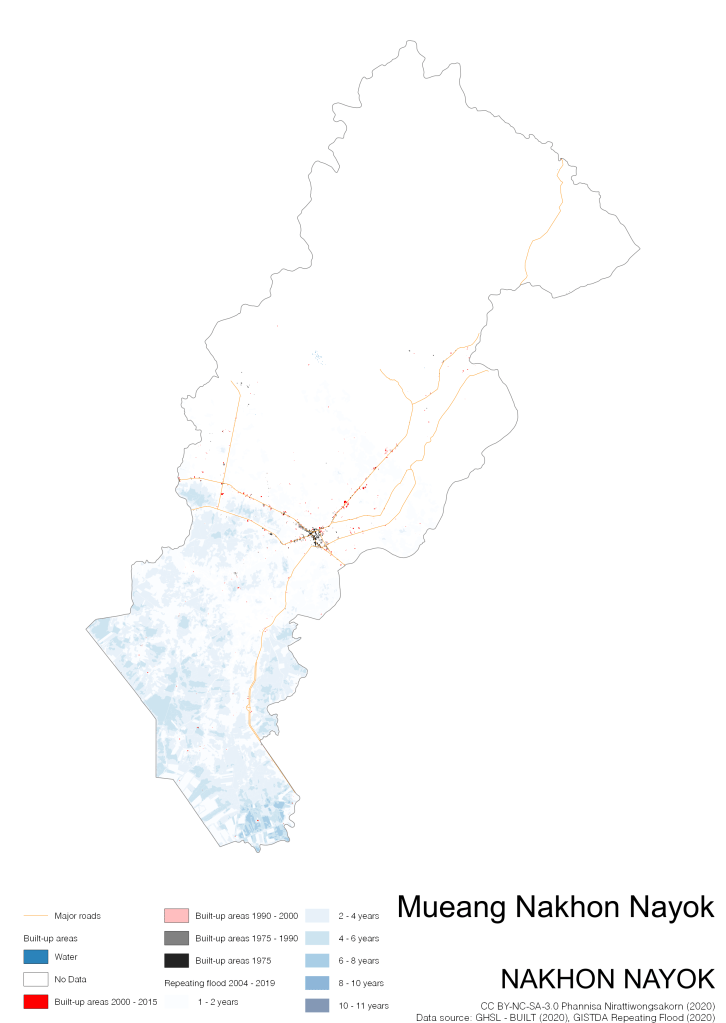
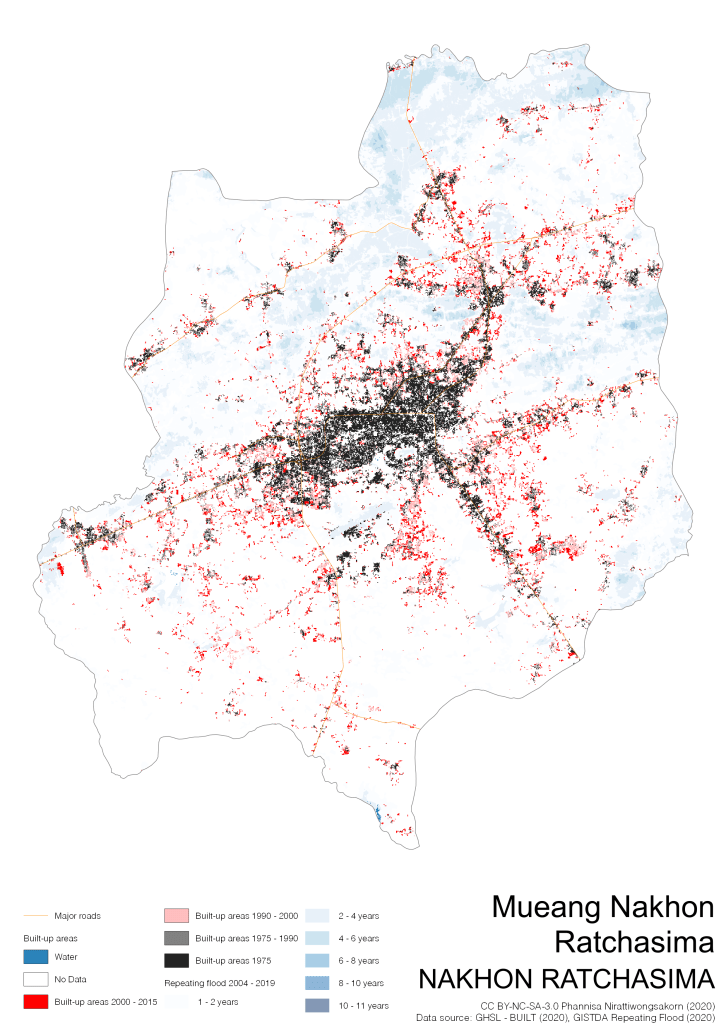
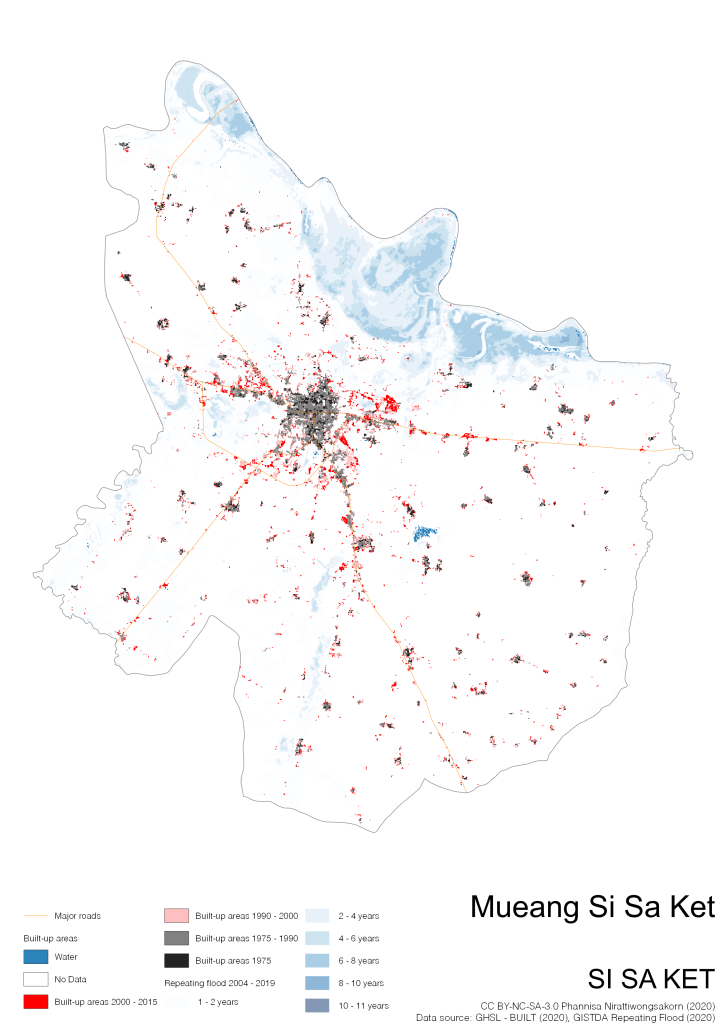
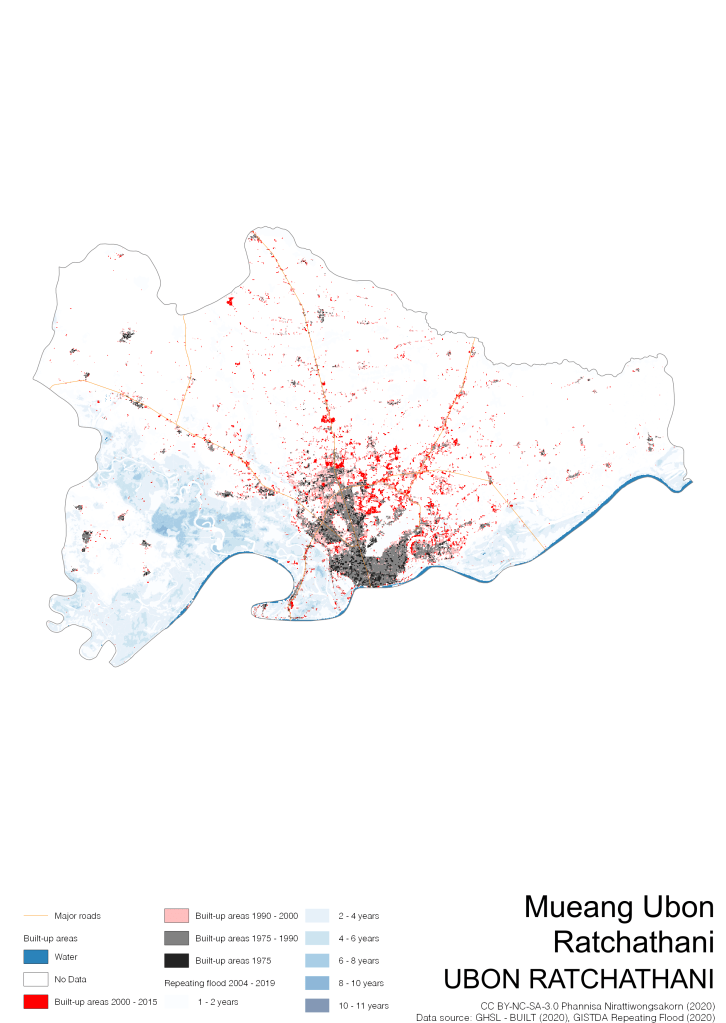
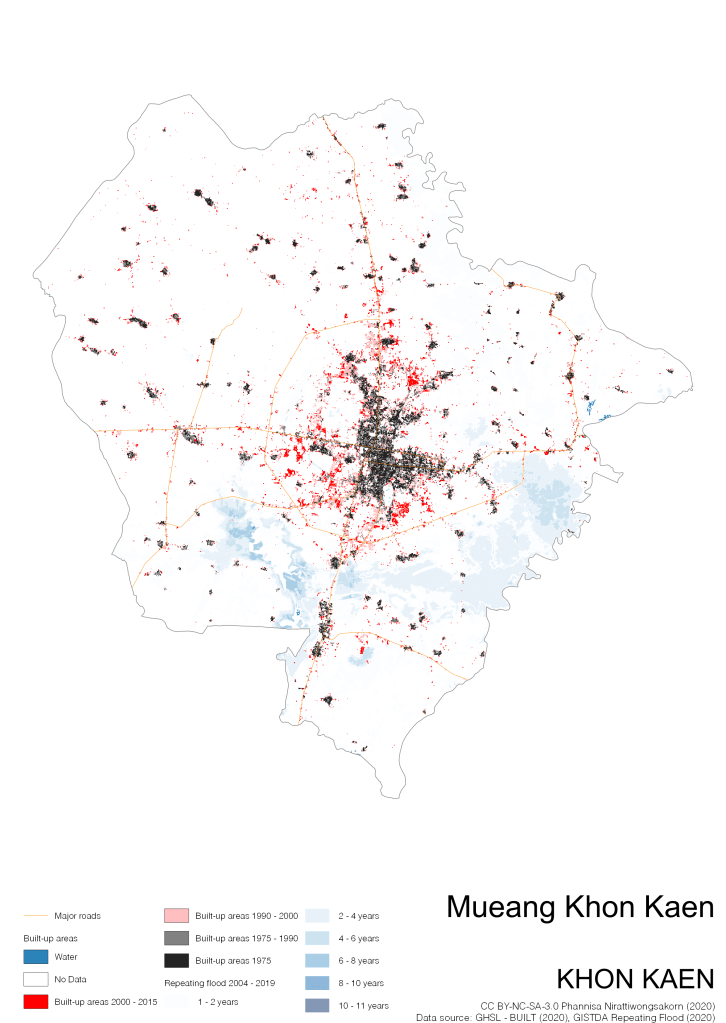
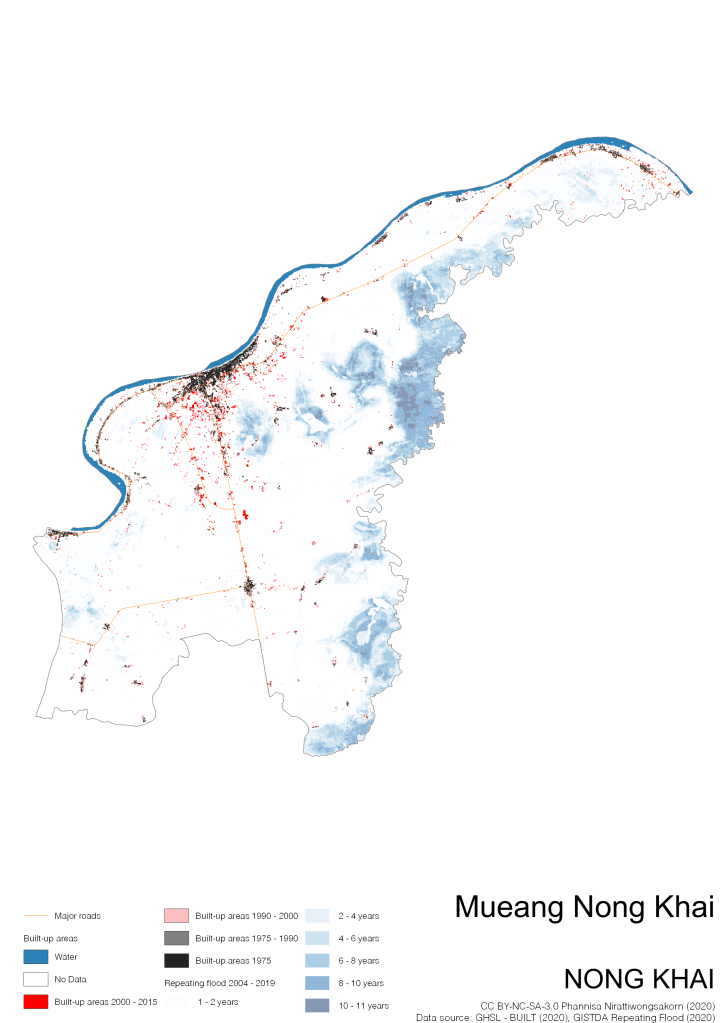
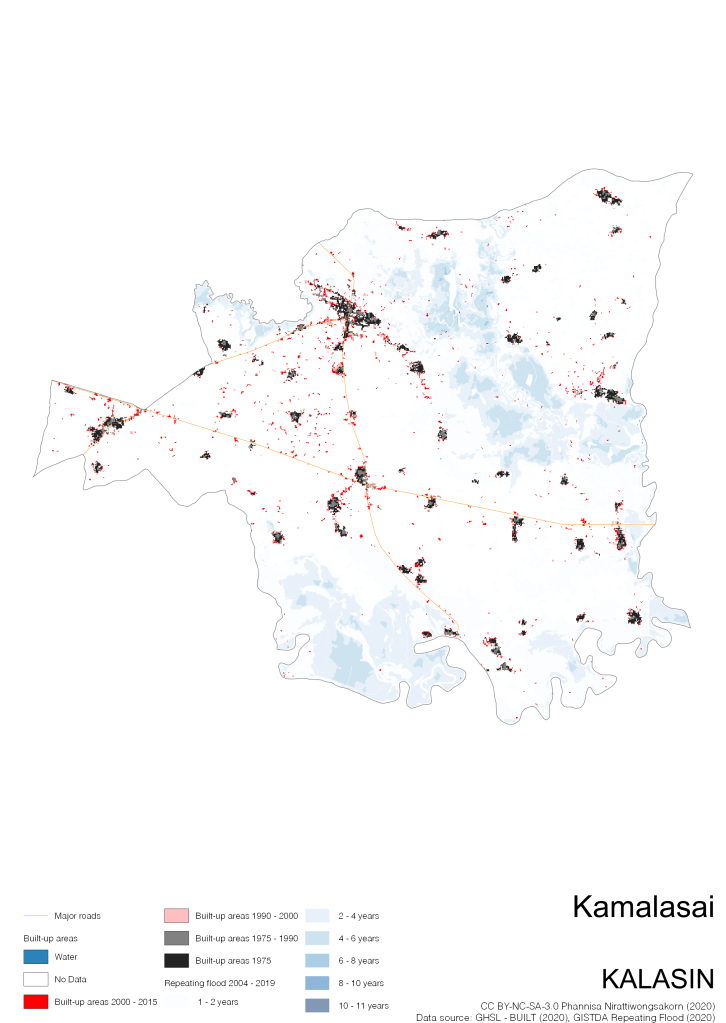
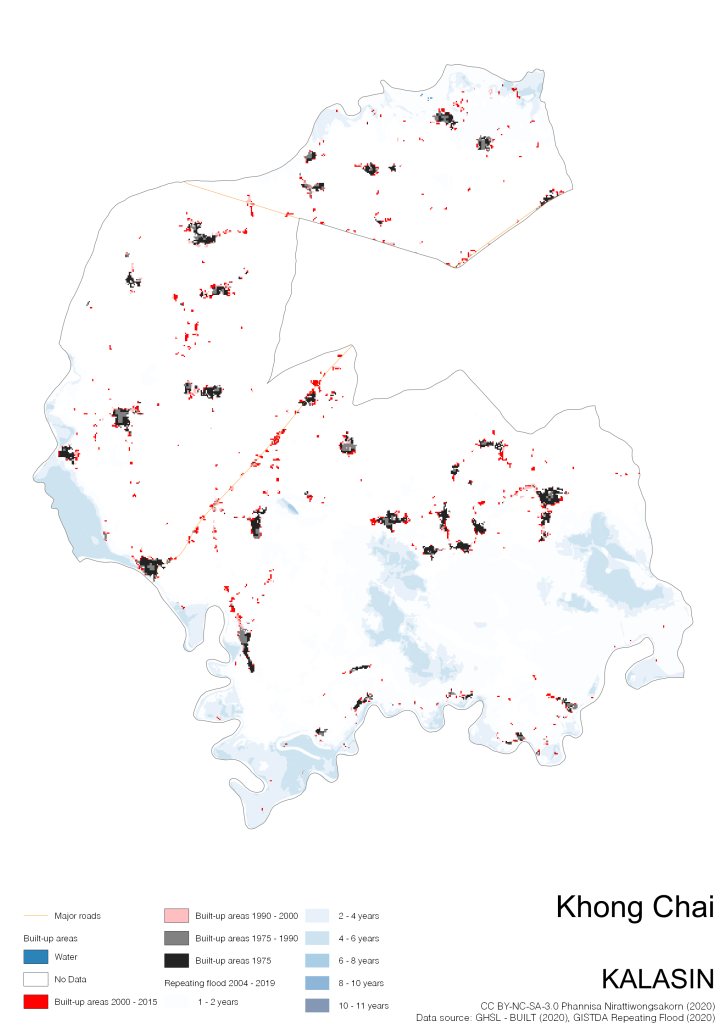
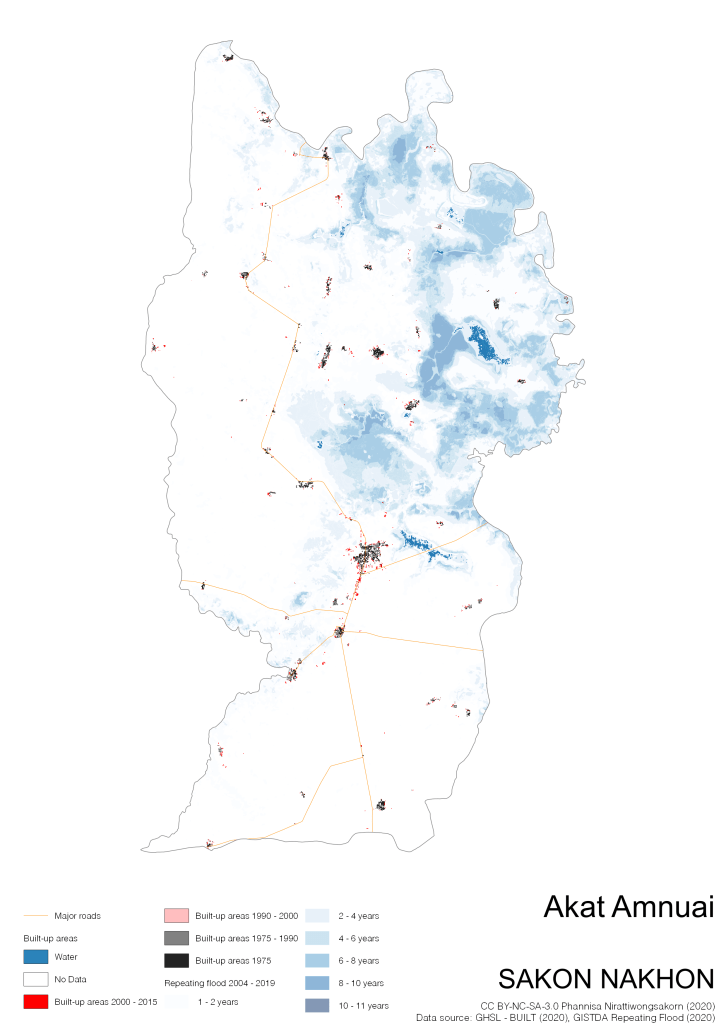
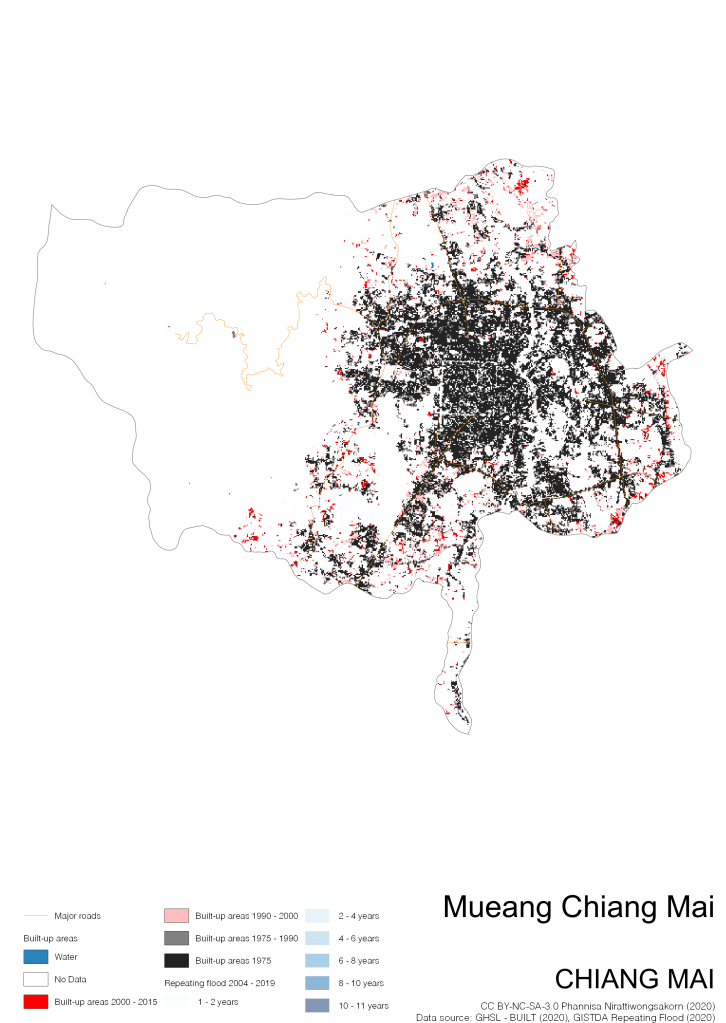
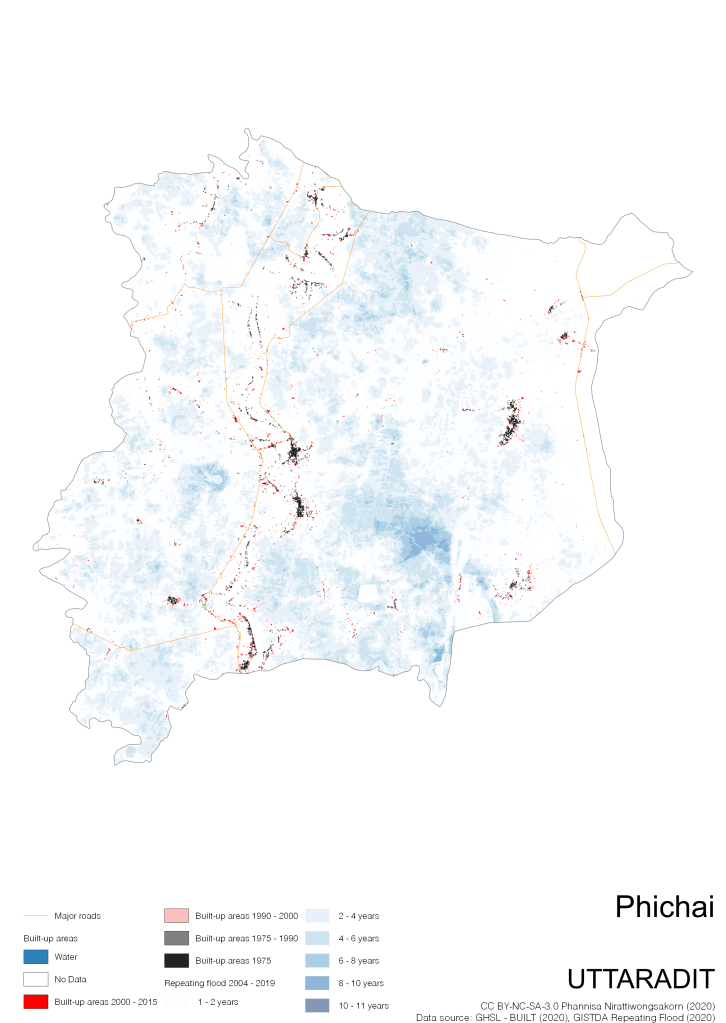
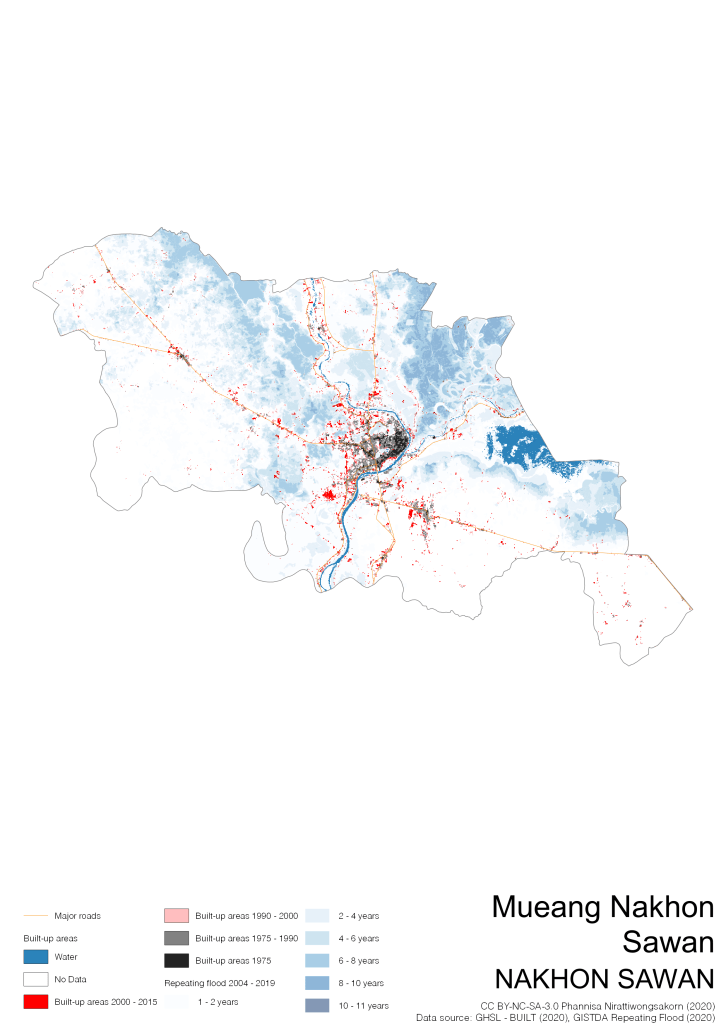
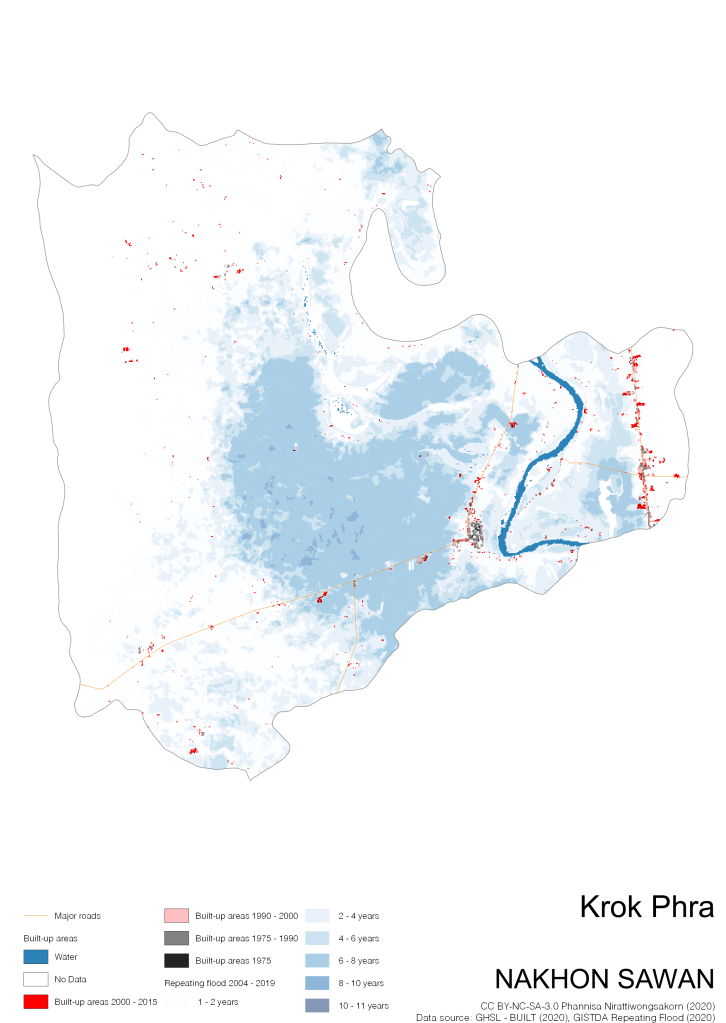
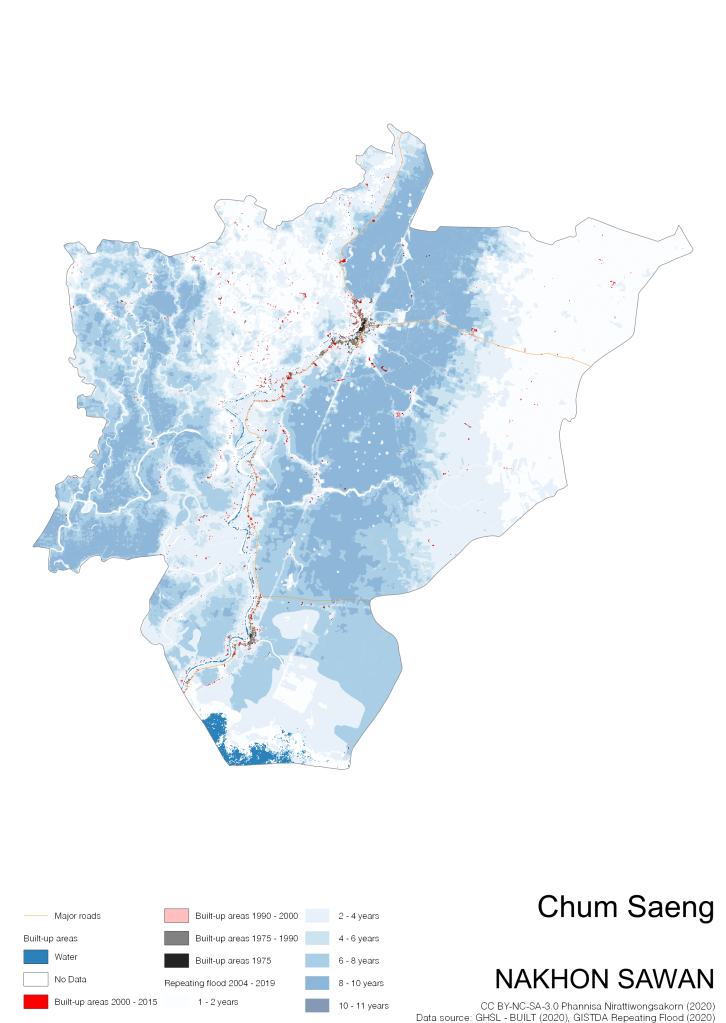
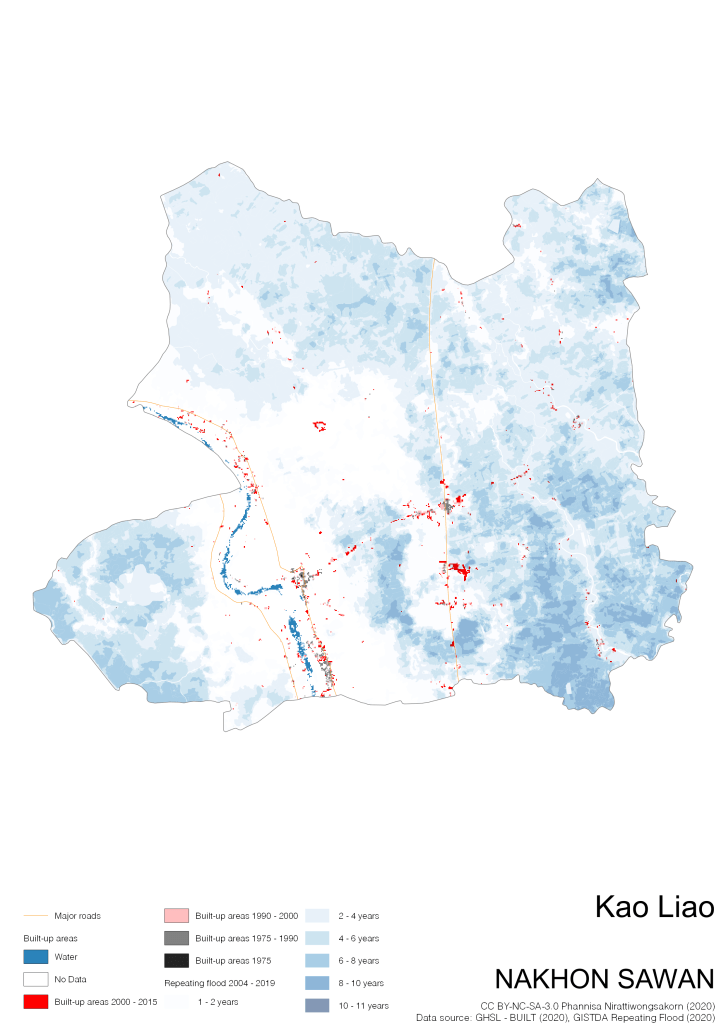
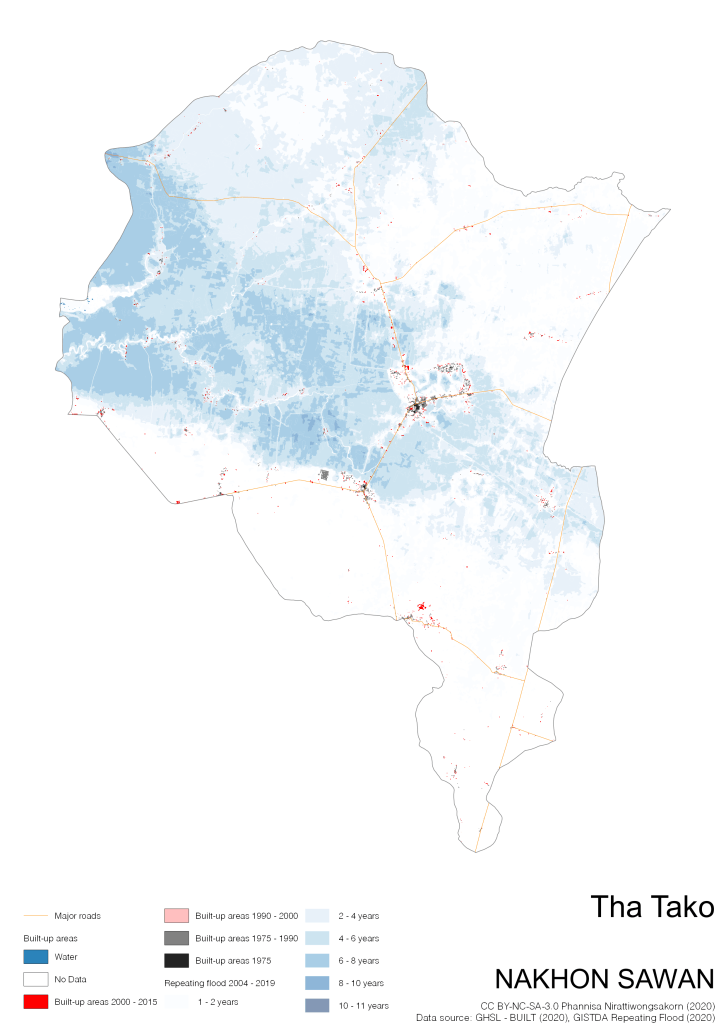
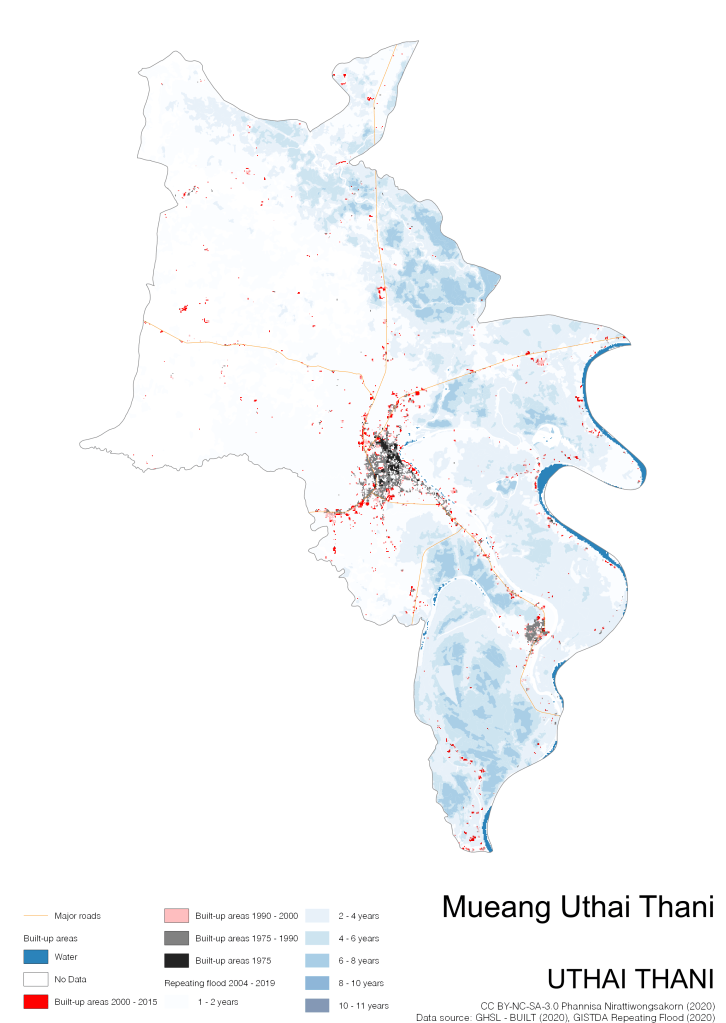
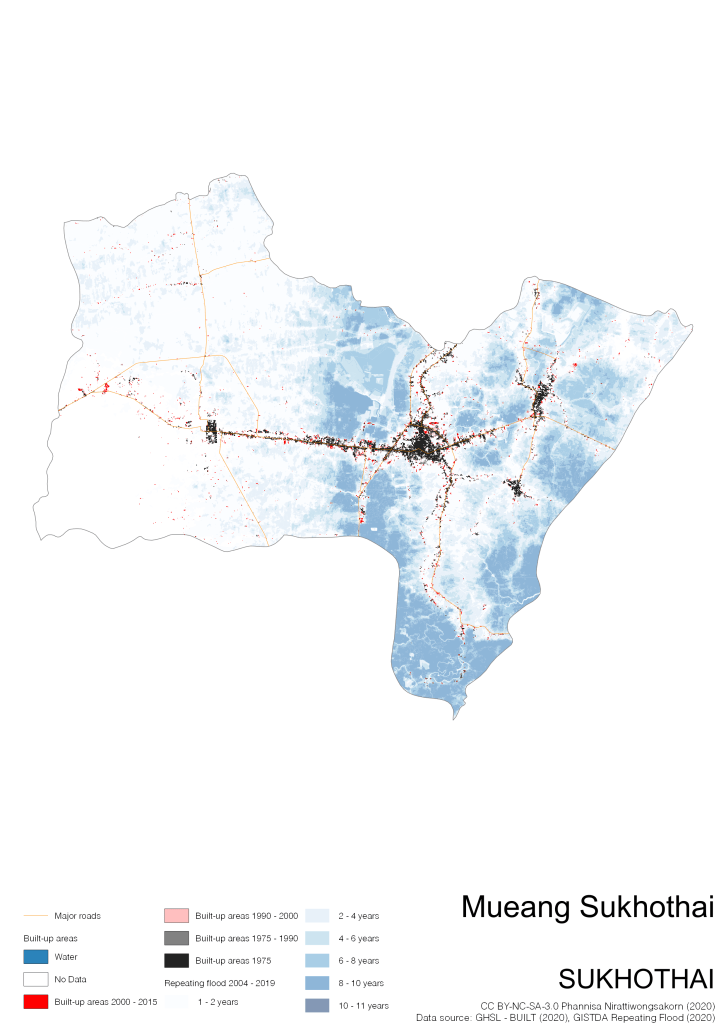
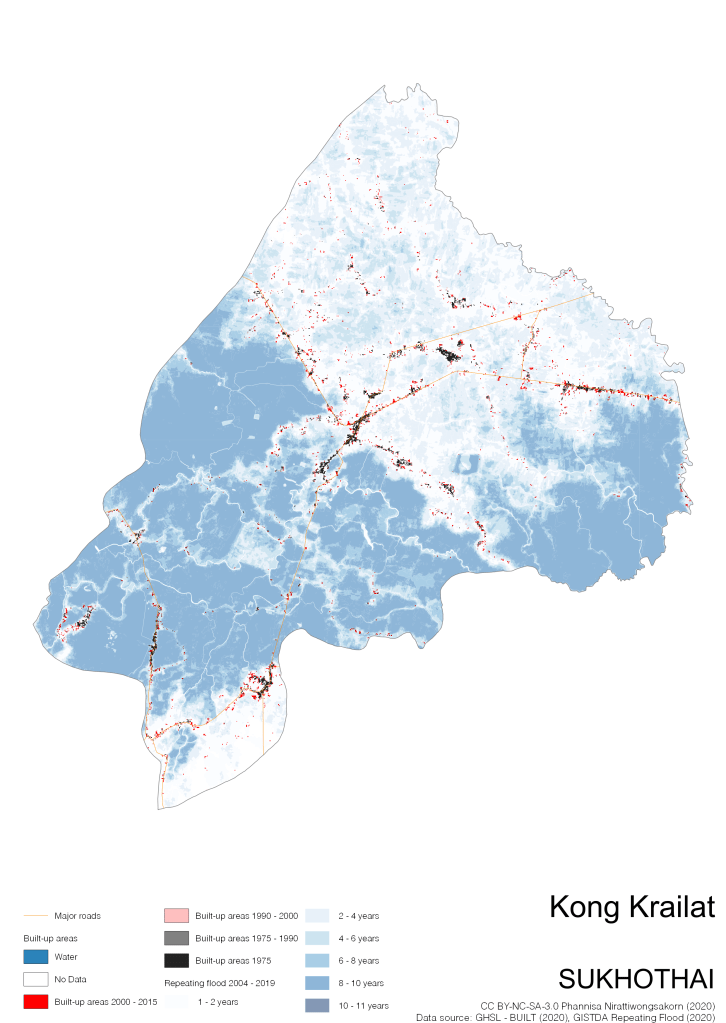
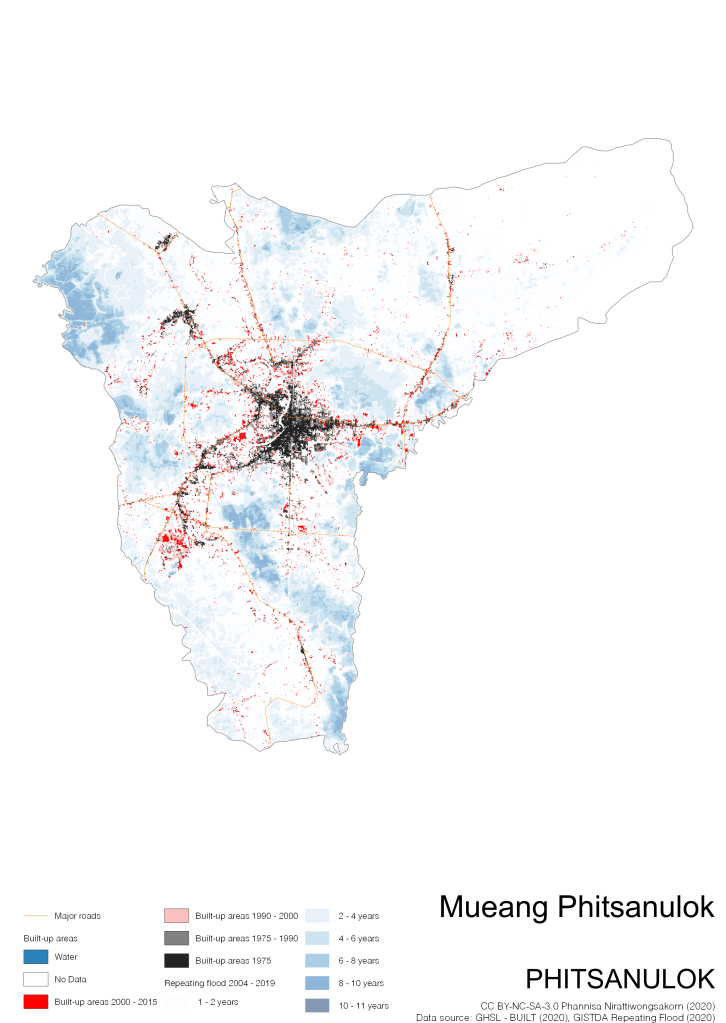
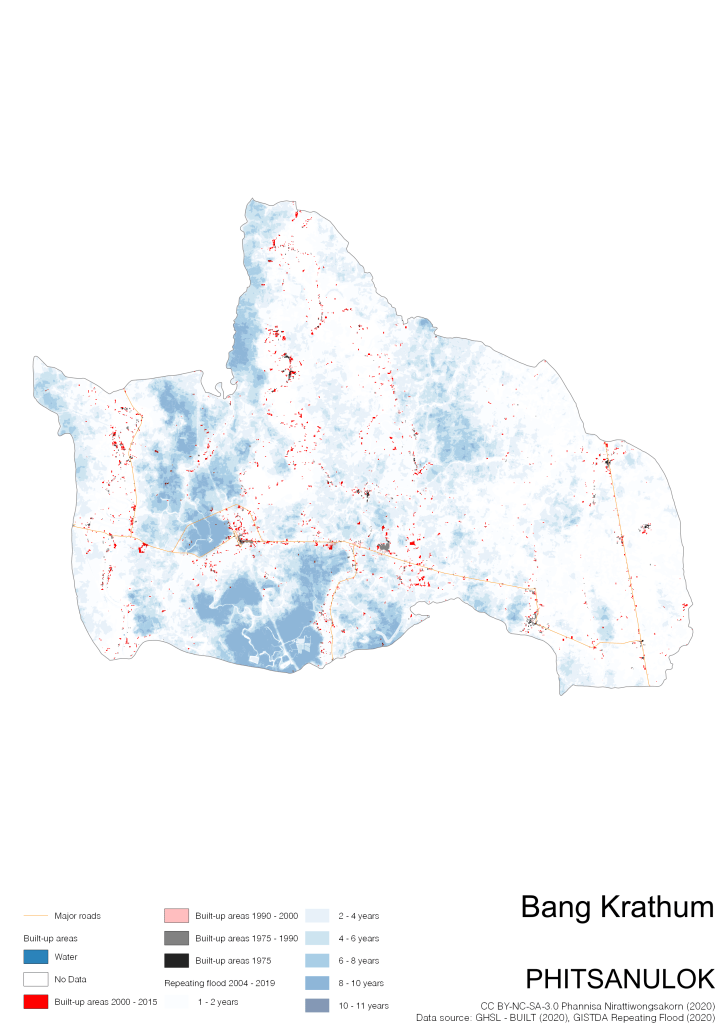
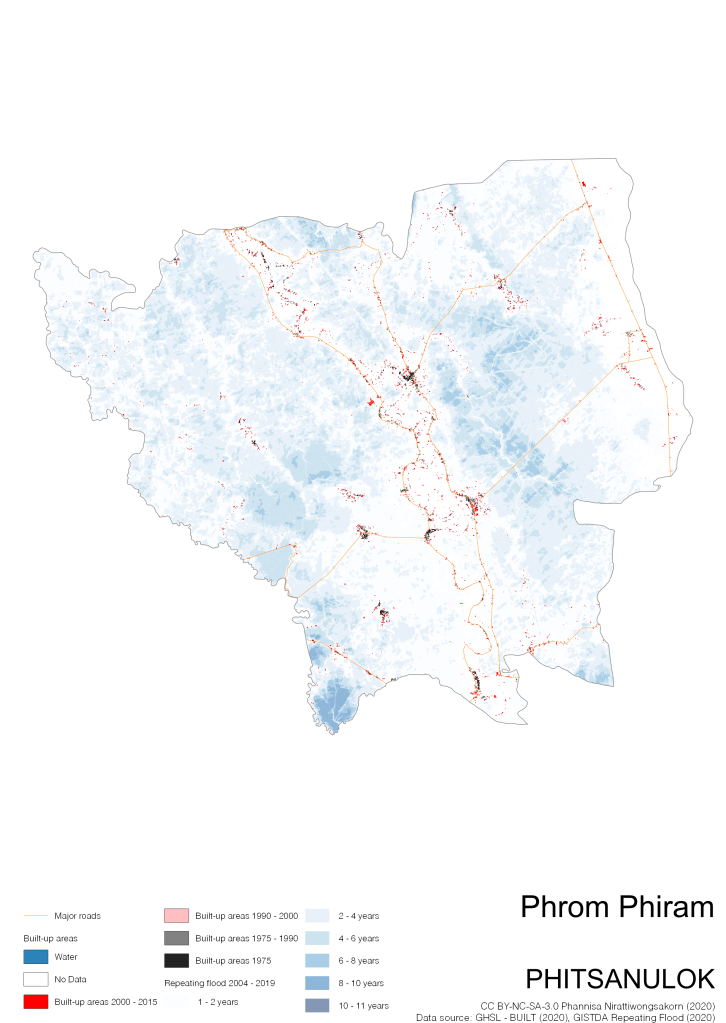
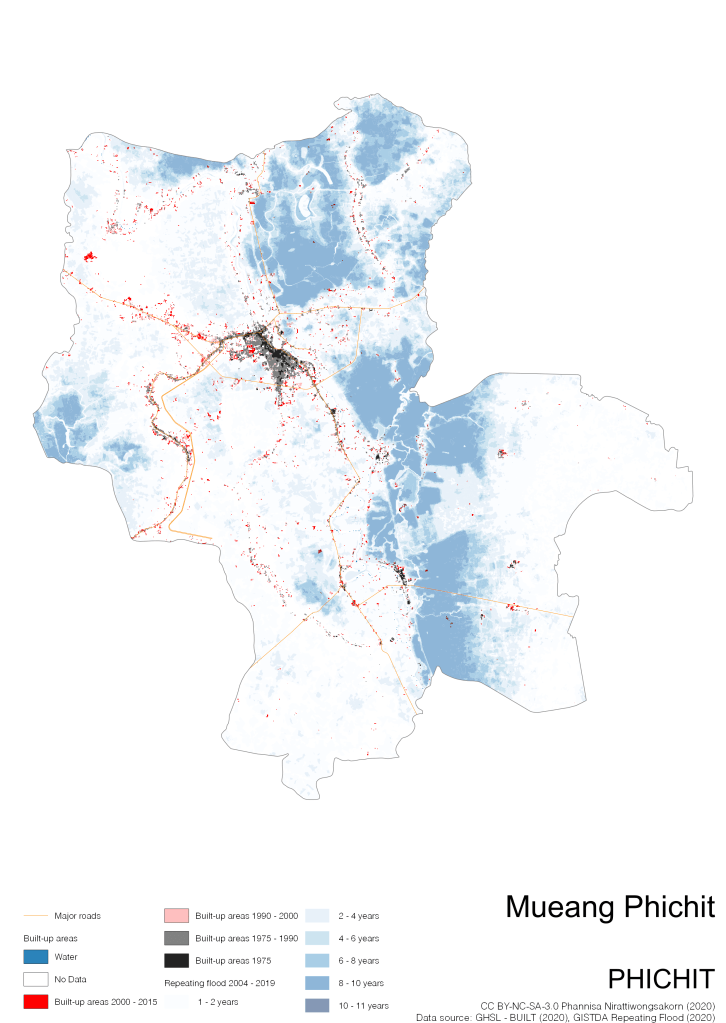
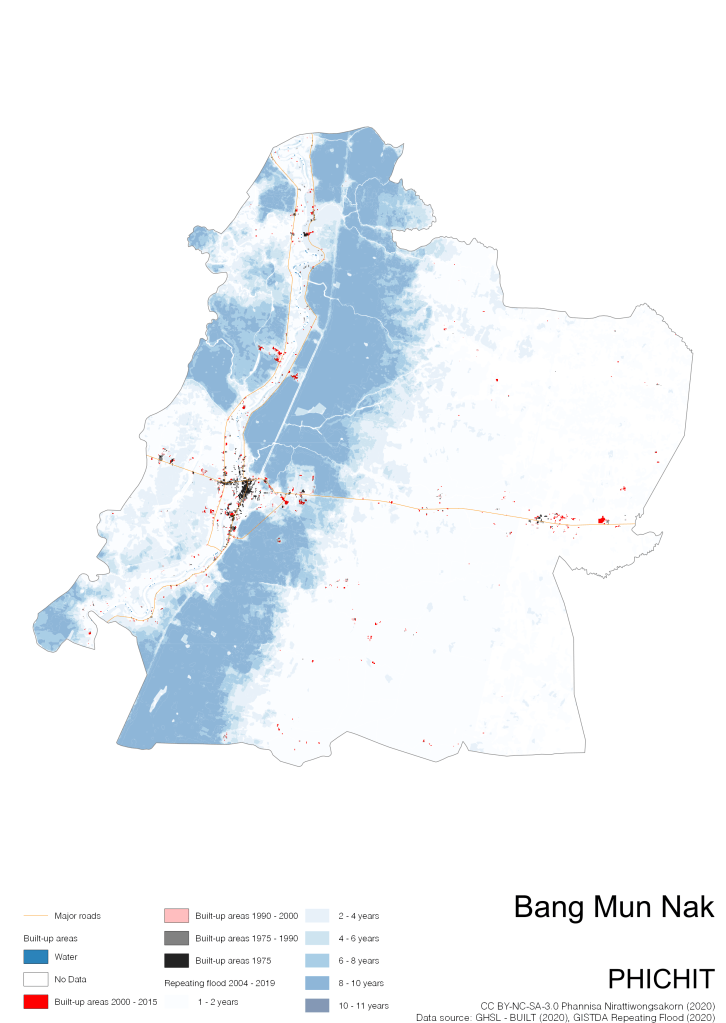
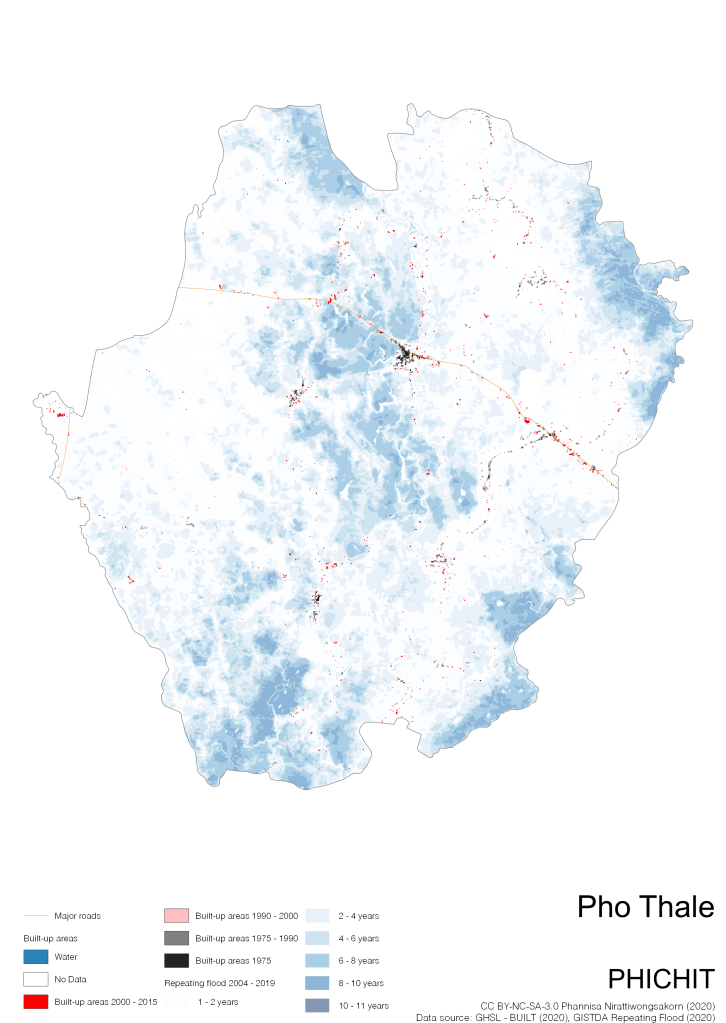
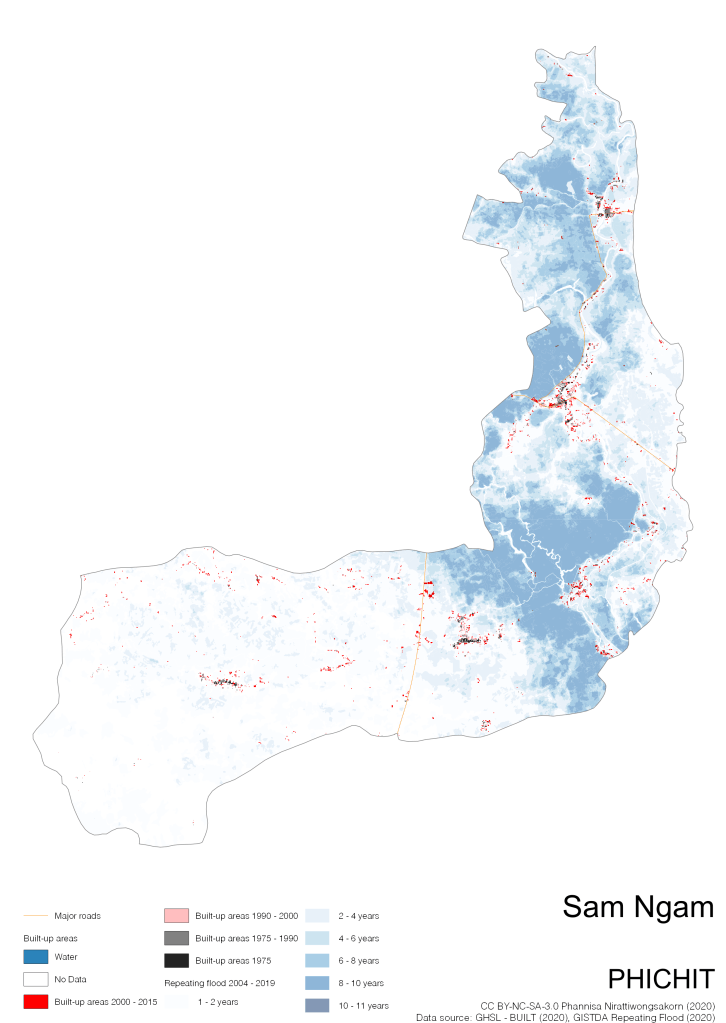
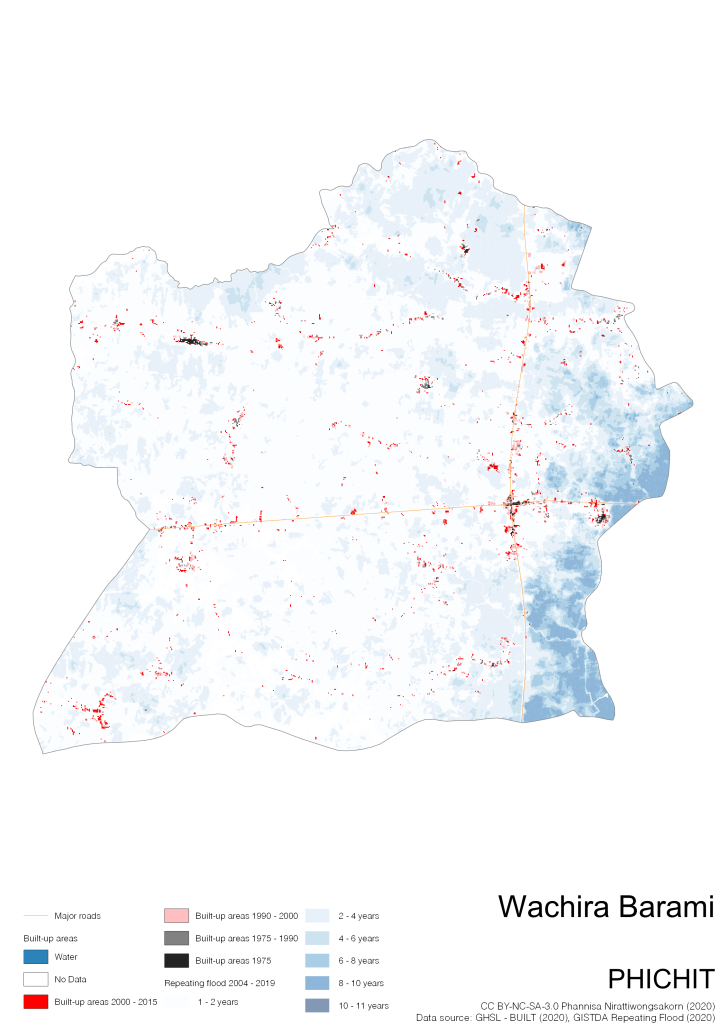
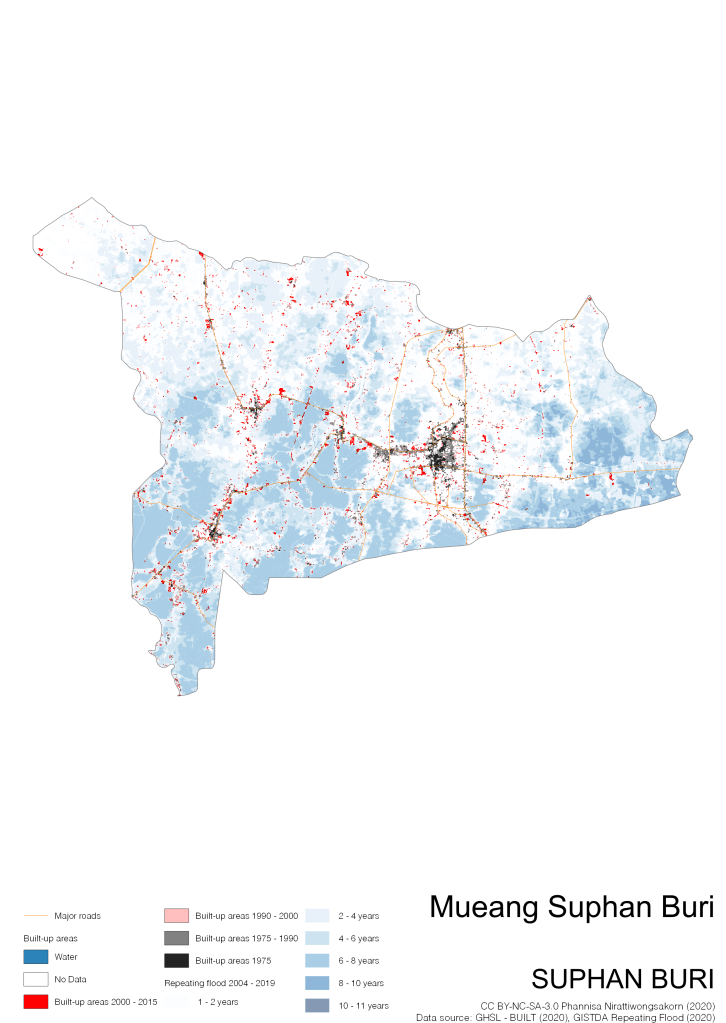
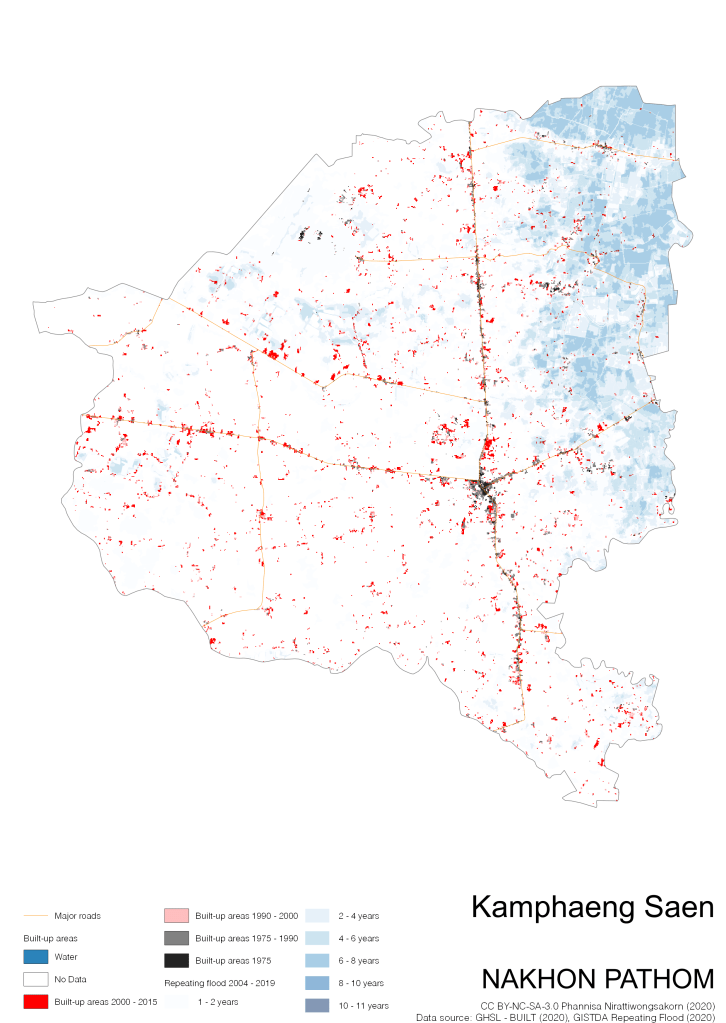
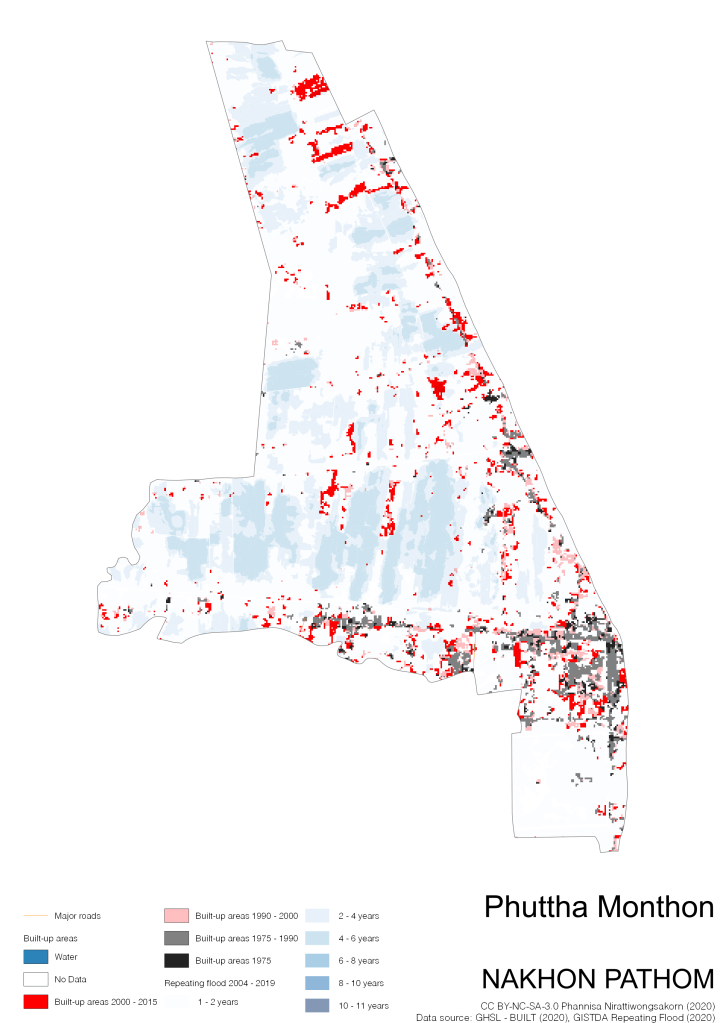
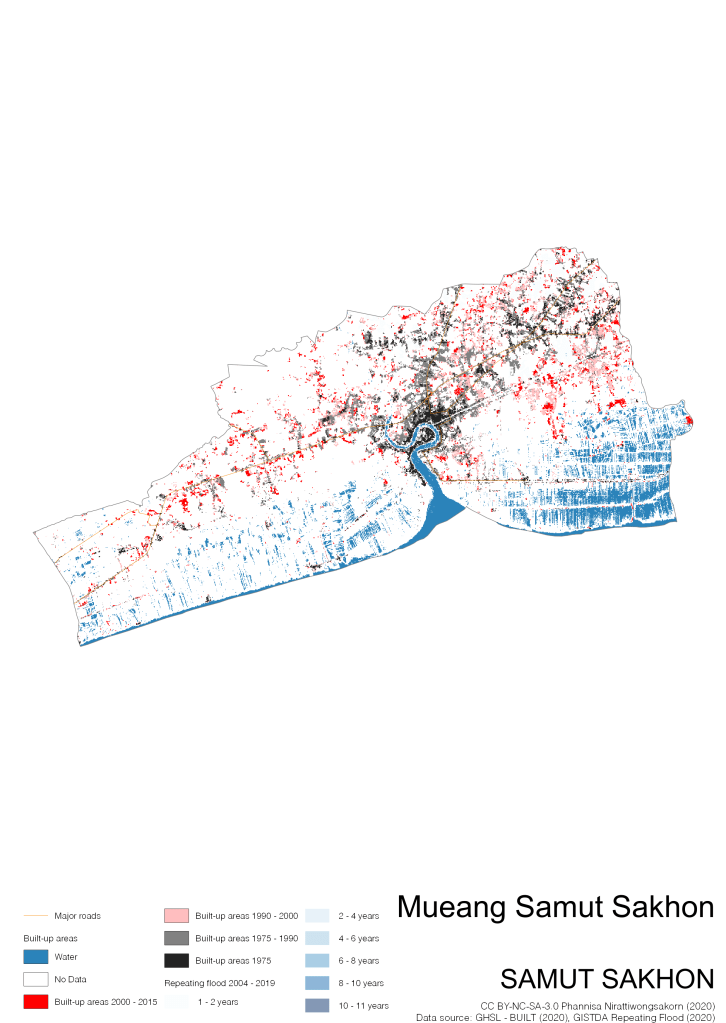
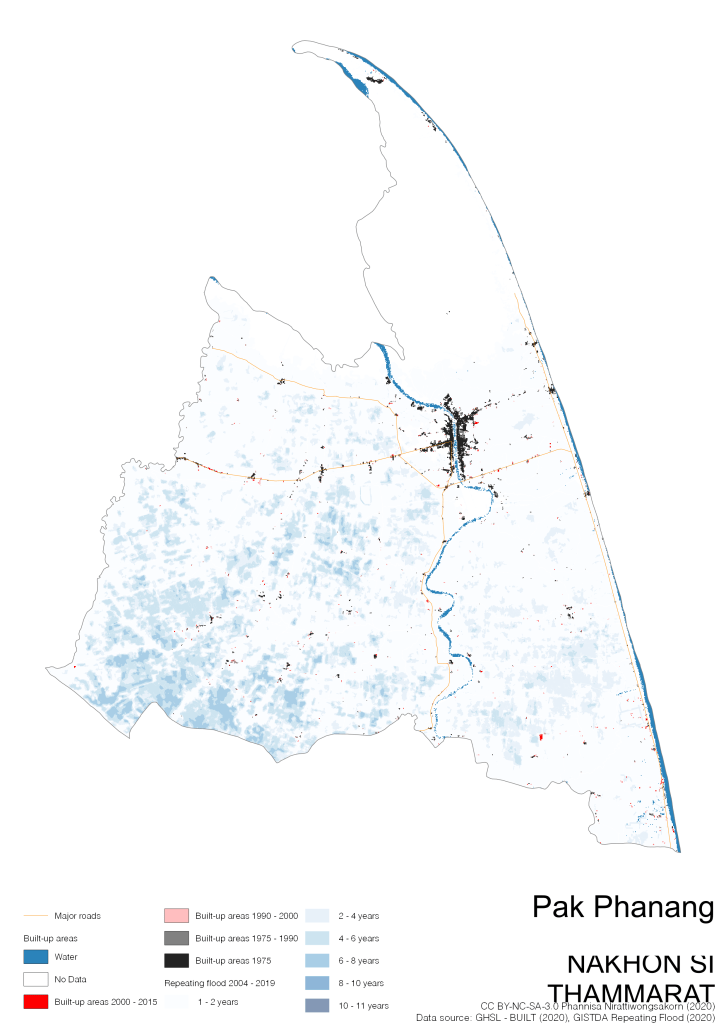
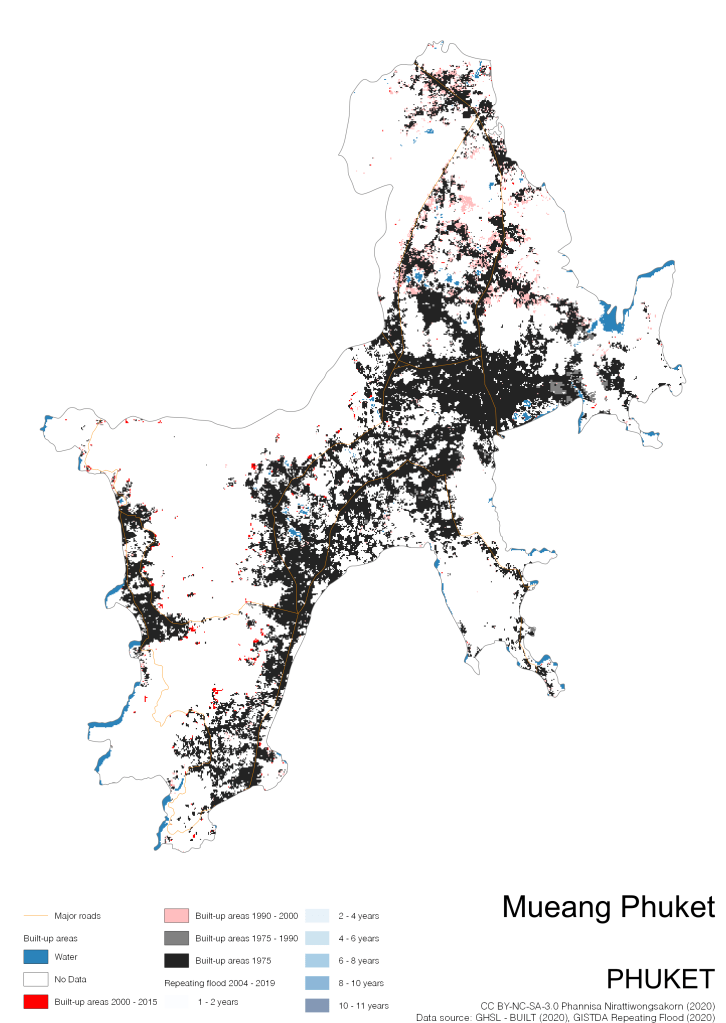
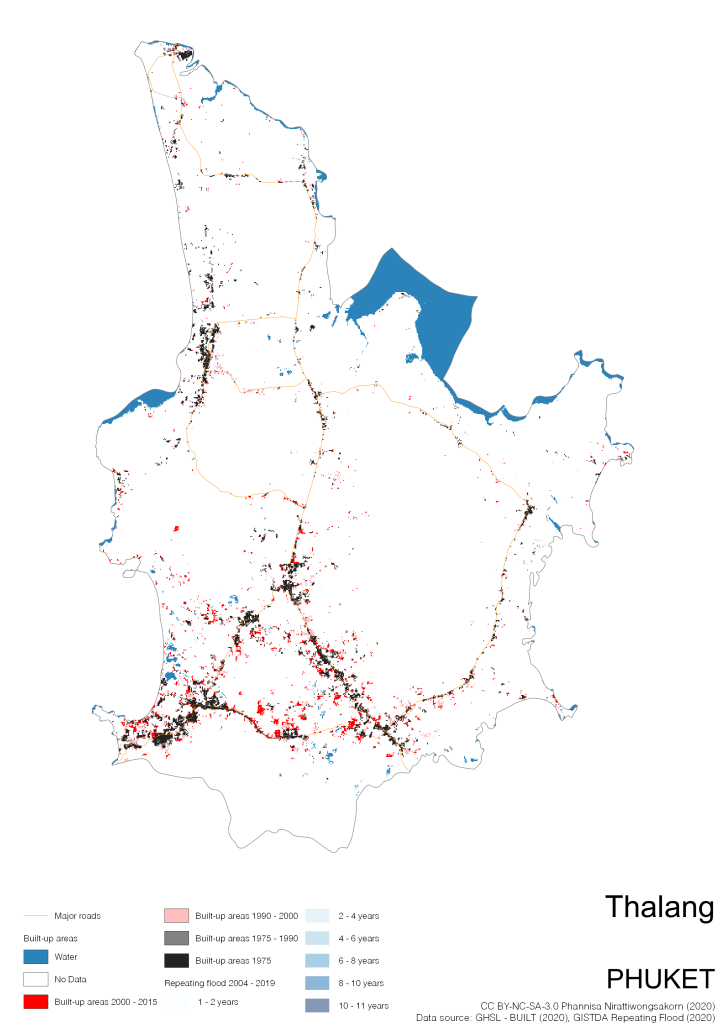
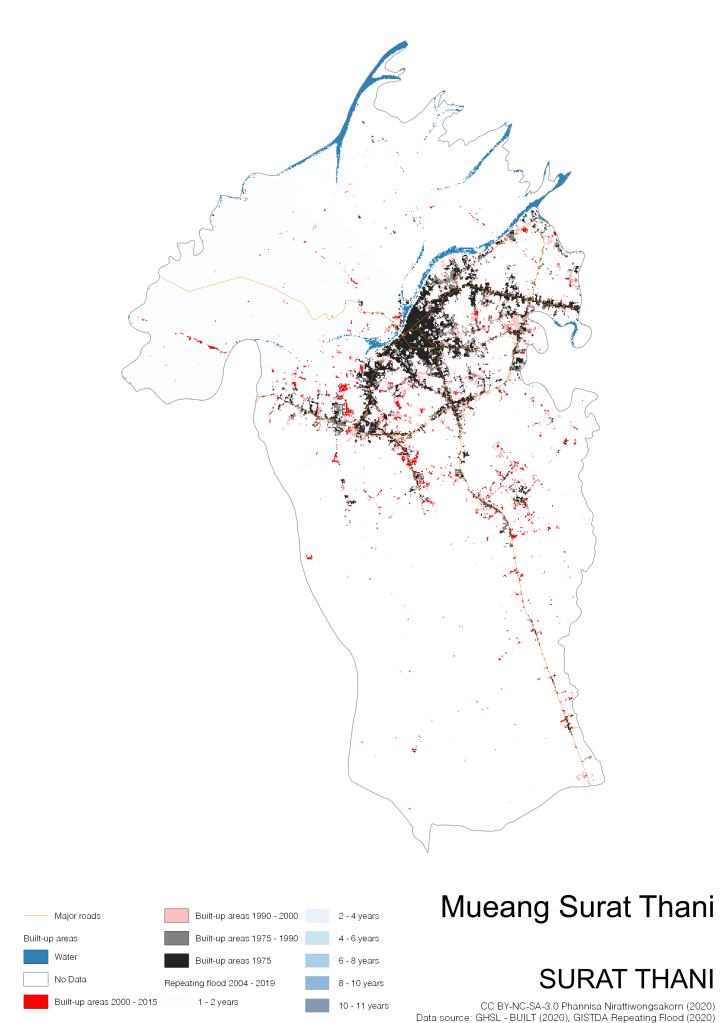
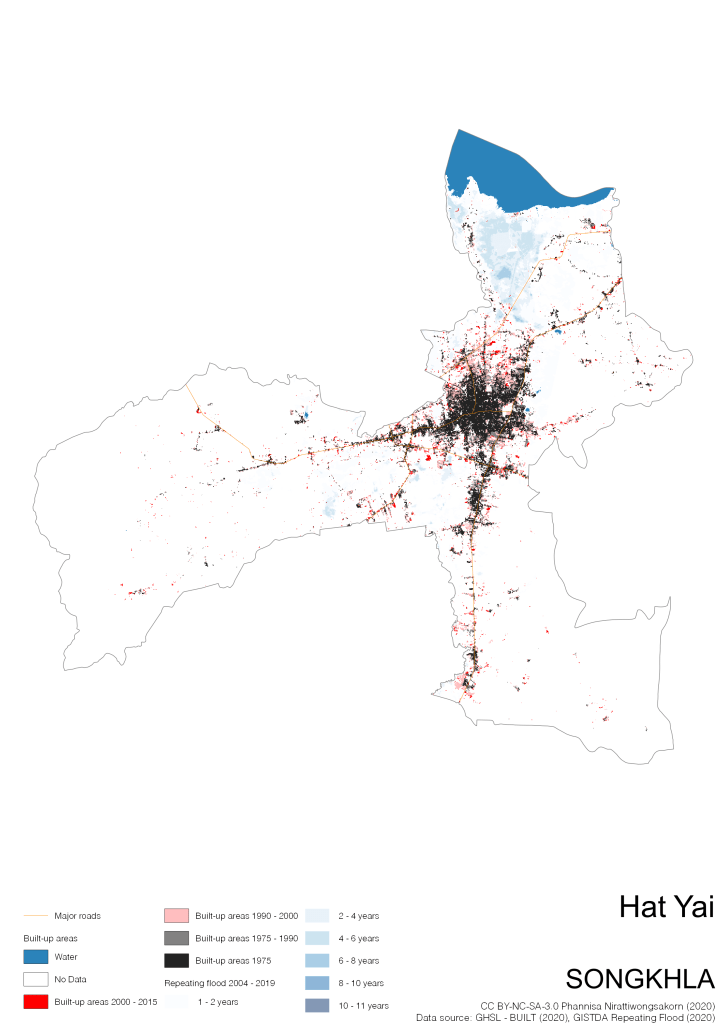
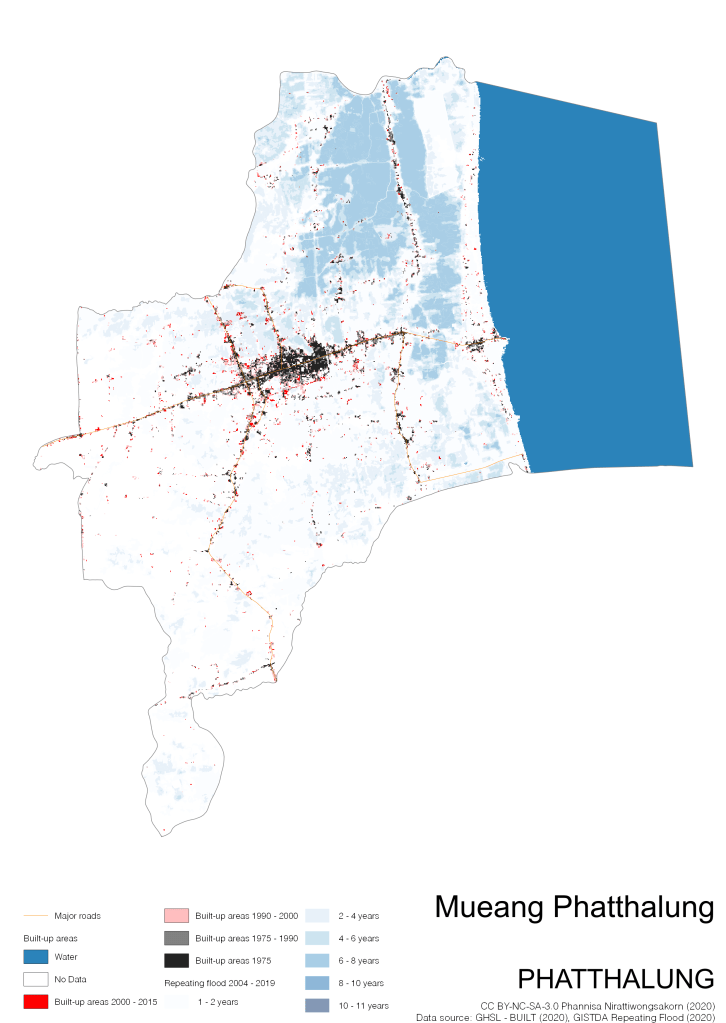
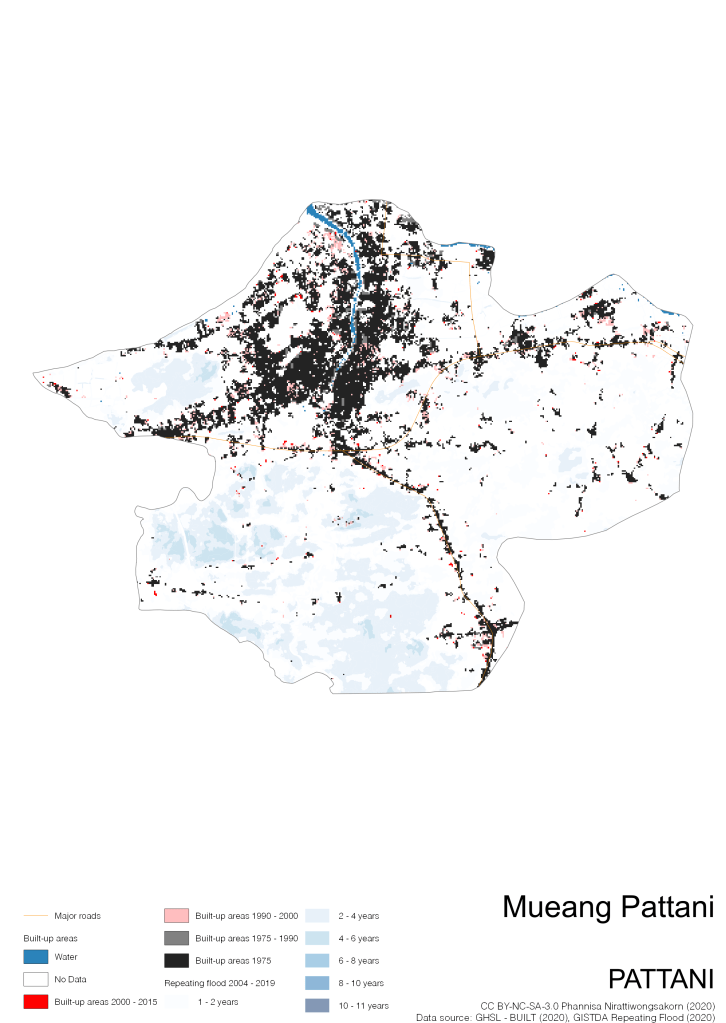
On the continuation of Thailand’s Built-up Areas 1975 – 2015 Visualization which show built-up areas of the 4 periods: until 1975, 1975 – 1990, 1990 – 2000, and 2000 – 2015, by province and by district (Amphoe); I add annual repeating flood layer of 2004 – 2019 (GISTDA, 2020) to the current visualization. According to UNDP (2020), Thailand is susceptible to extreme weather events such as tropical storms, floods and drought because of climate change. With the fact that Thai settlements are usually close to rivers and shorelines, the highest repeating flooding, calculated from GISTDA dataset, is 11 out of 15 years. Here you will see many cities with high flood risks.
Legends:
- Black: built-up areas of 1975
- Grey: built-up areas epoch 1975 – 1990
- Pink: built-up areas epoch 191990 – 2000
- Red: built-up areas epoch 2000 – 2015
- Blue: water
- Blue color ramp: annual repeating flood areas between 2004 – 2019, darker tone indicates higher degree (more years) of repeating floods
- Yellow line: major road networks
Data source: (1) European Commission’s Global Human Settlement Layer (GHSL) – BUILT (2020); (2) GISTDA Repeating Floods 2004 – 2019
Built-up Areas and Repeating Floods of 77 Provinces


Built-up Areas and Repeating Floods of the Selected Cities

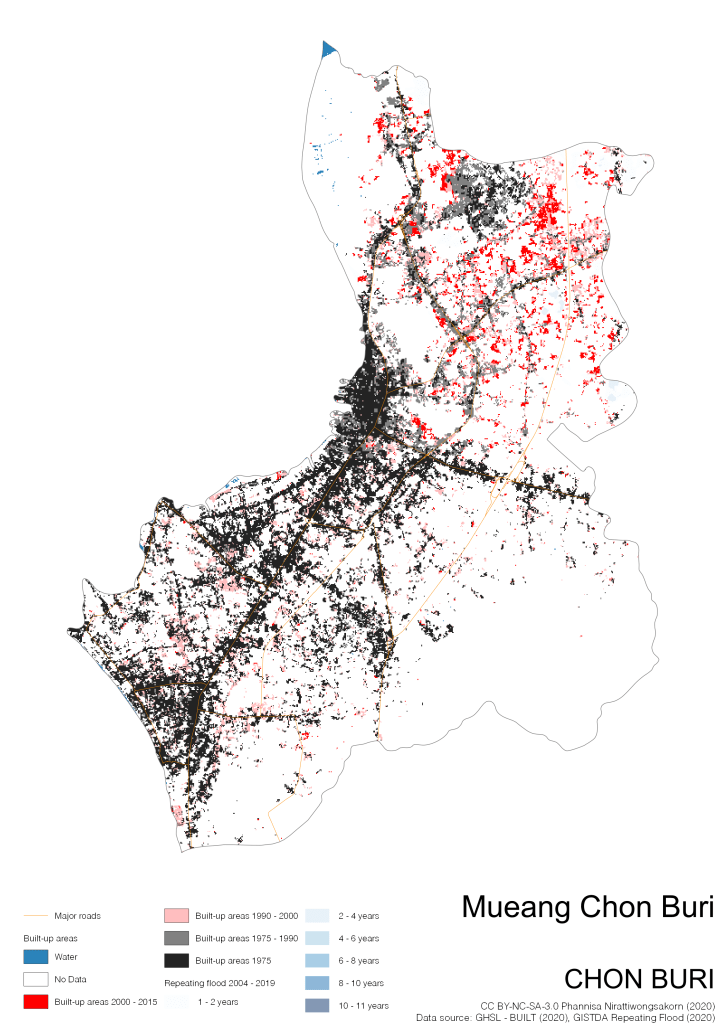


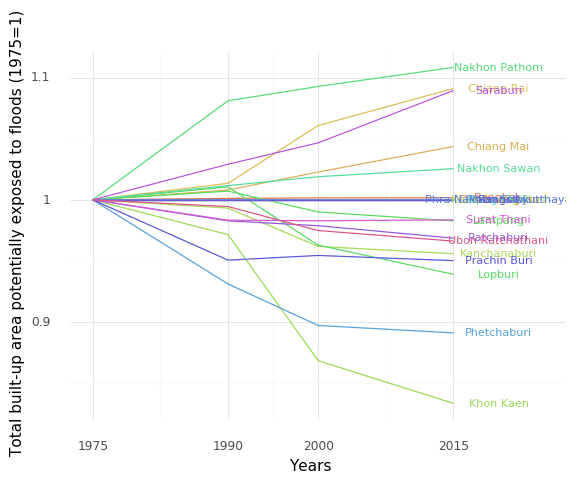
Cities with The Highest Increase in Flood Exposure
Using the calculated flood exposure of 41 urban centers (defined by specific cut-off values on resident population and built-up surface share in a 1×1 km uniform global grid) of GHSL – Urban Centre Database 2019 (UCDB R2019A) dataset, we compare the changes of percent of built-up areas under flood exposure to total built-up areas in each year (1975, 1990, 2000, and 2015). Potentially built-up areas are expected to grow no more than flood exposure areas (the output number <= 1). As you can see Chonburi has increased its exposure to flood twice than that of 1975.

Tutorials here.


One thought on “Thailand’s Built-up Areas and Repeating Floods Visualization”