
My procrastination project visualizing Thailand’s Built-up areas: human settlements characterized by constructed, man-made objects that include buildings, associated structures, civil works (GHSL, 2019). In a nutshell, built-up areas are physical aspect of a city. Visualizing built-up areas help us understand human settlements, urban patterns, economic and infrastructure development, and even possible underlying problems such as urban sprawl. Apart from urban planning rationale, I want to create artistic yet informative maps that everyone can enjoy while having some useful information.
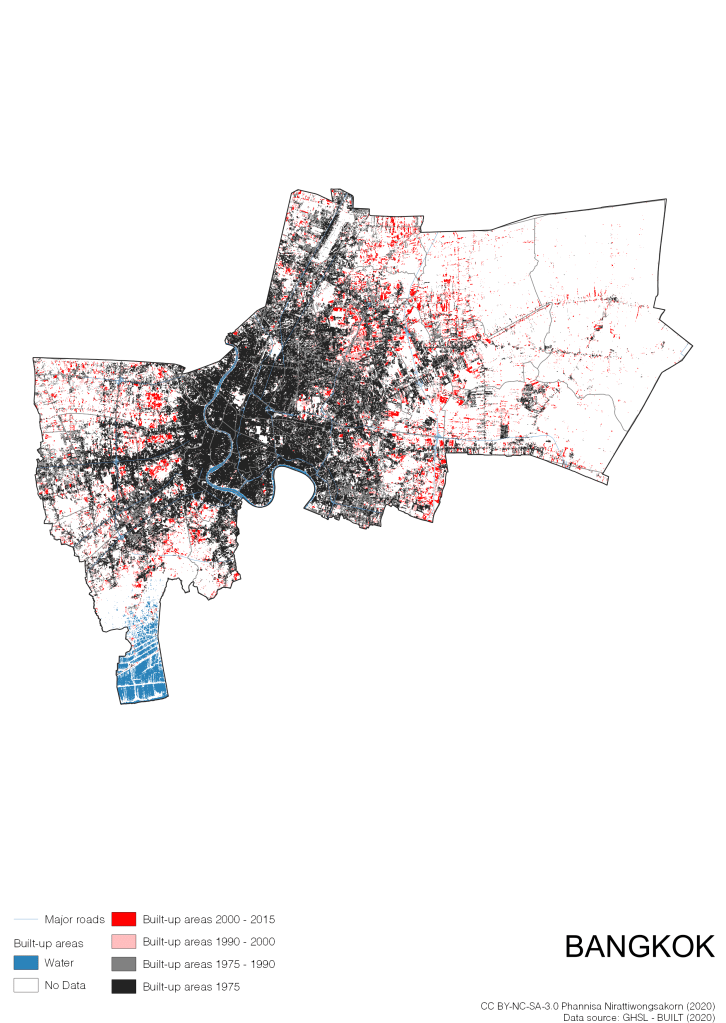
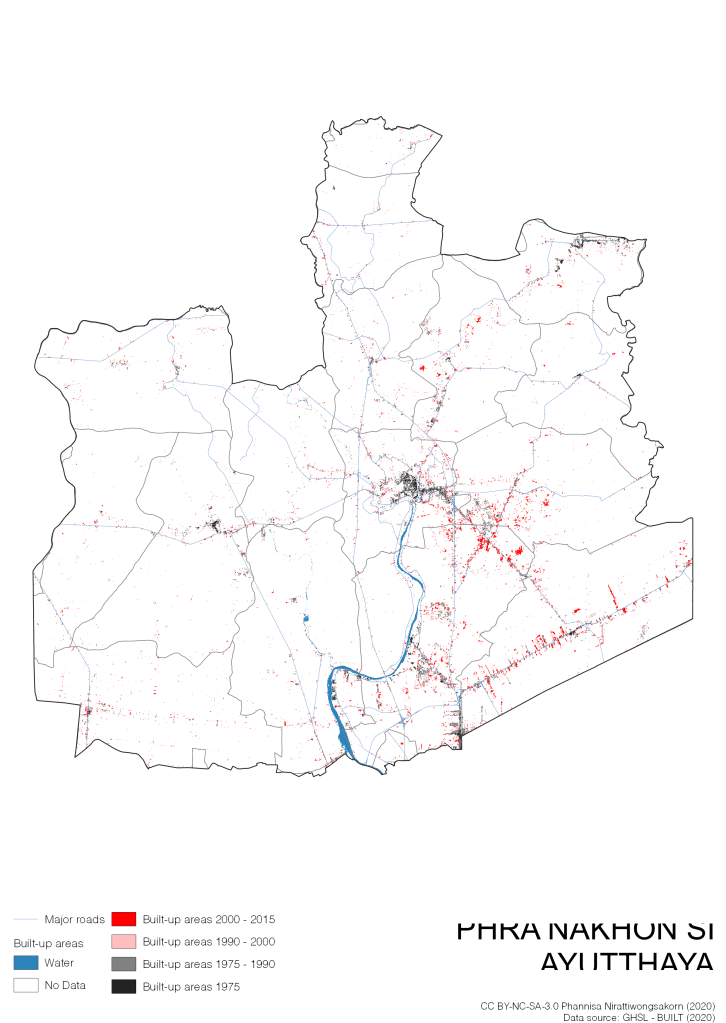
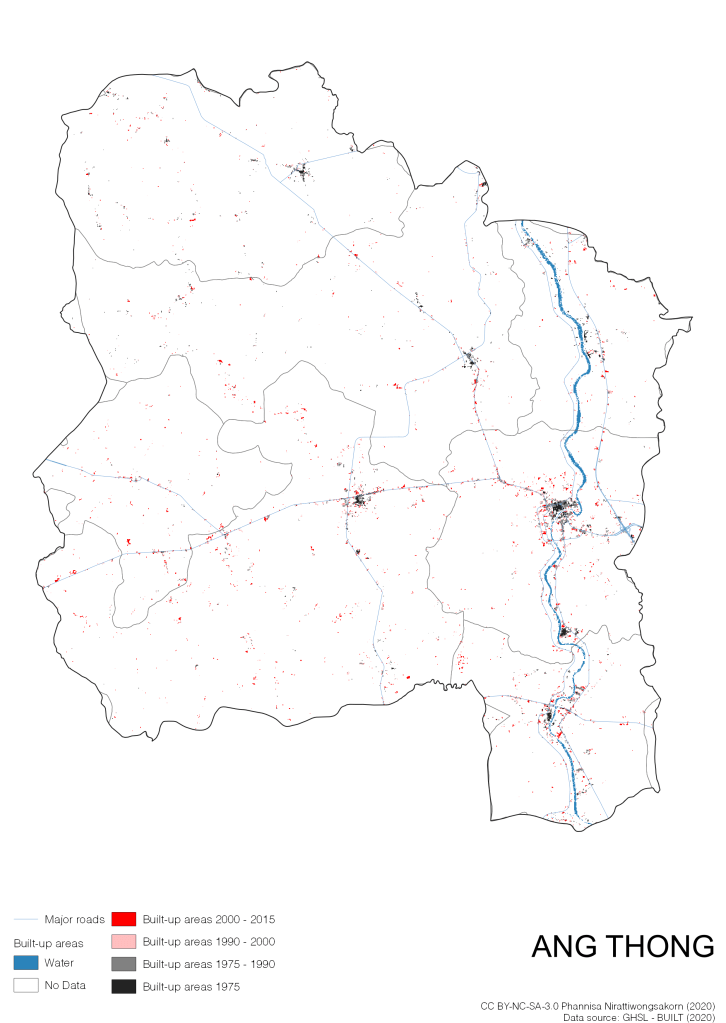
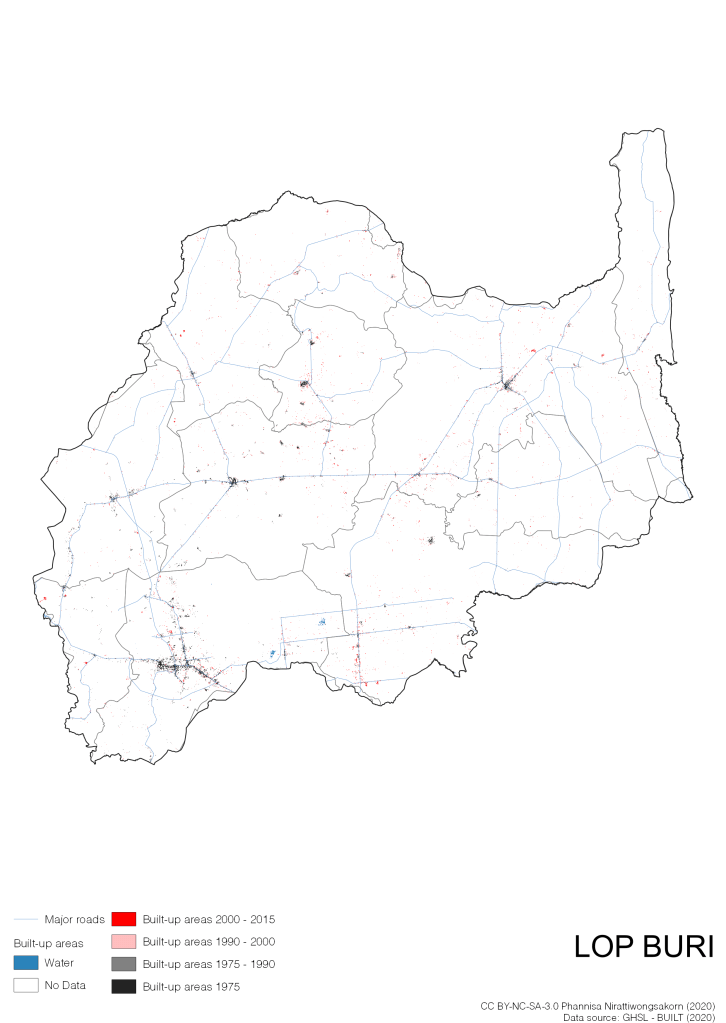
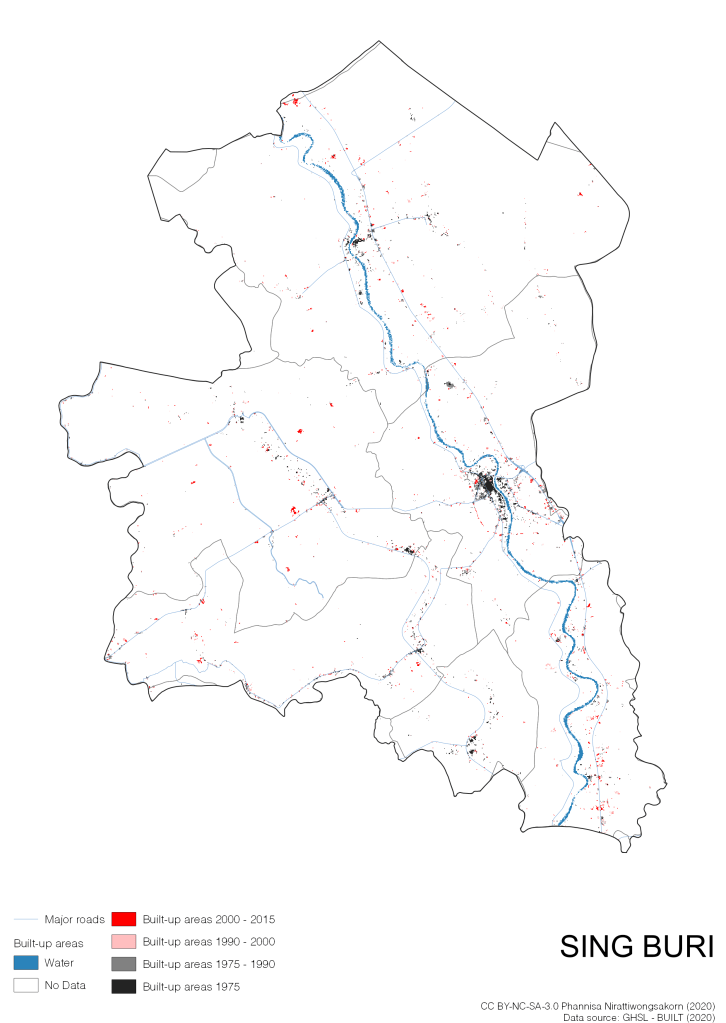
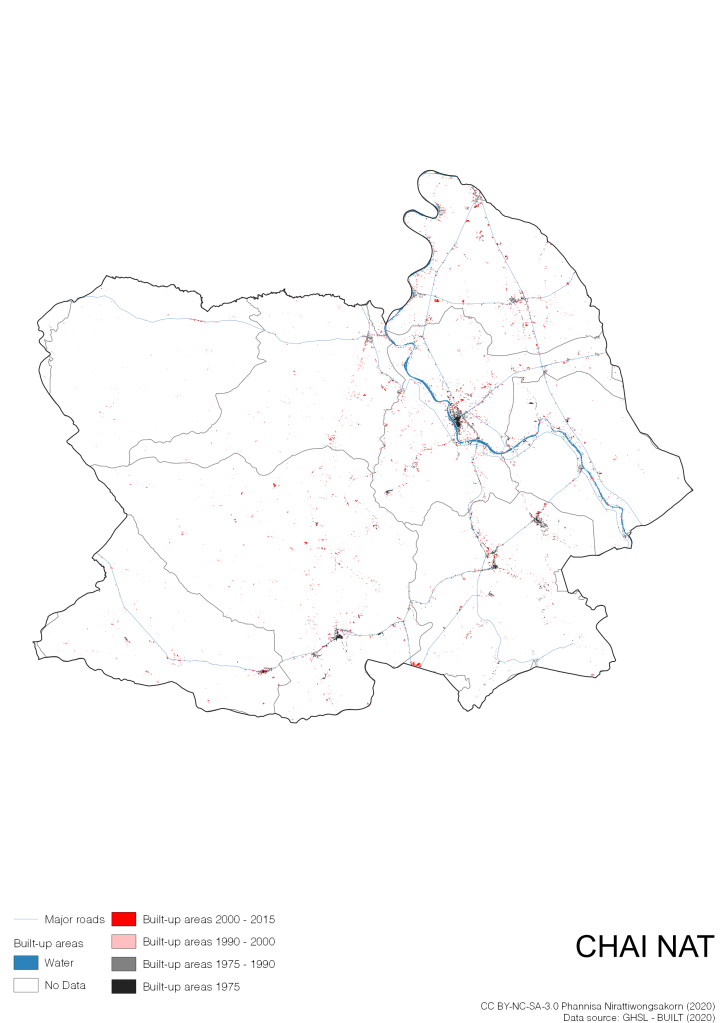
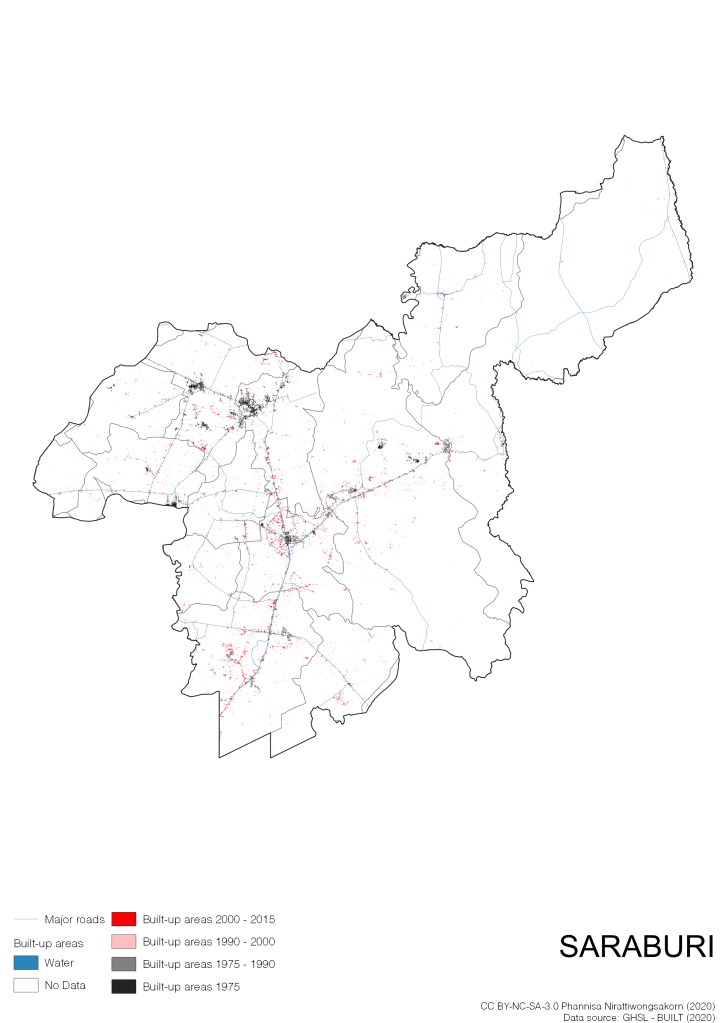
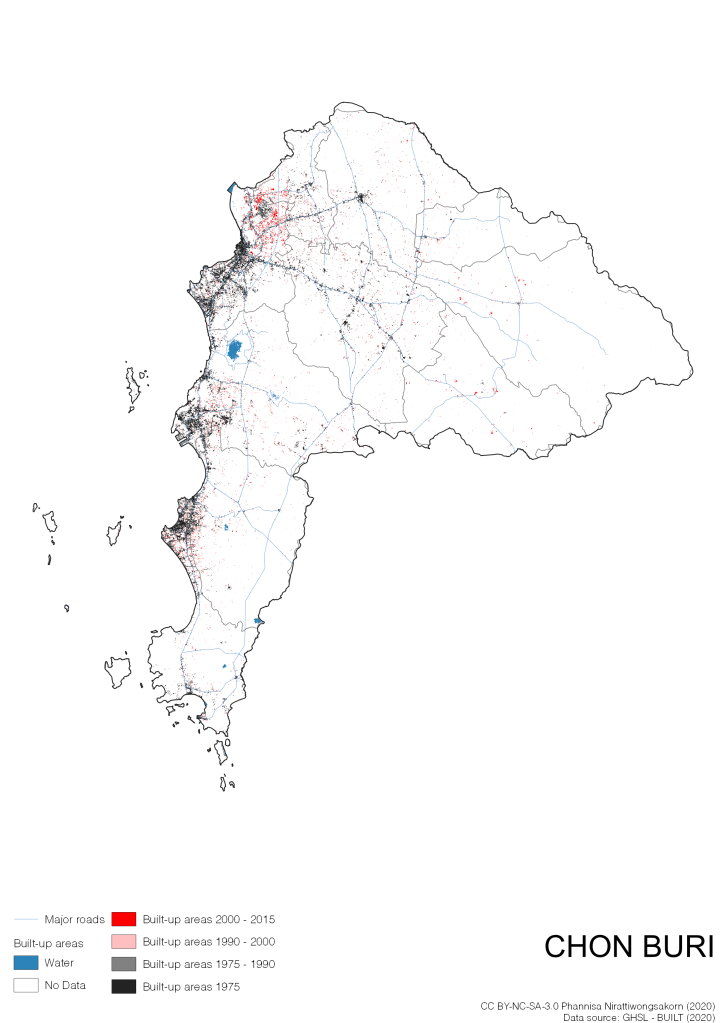
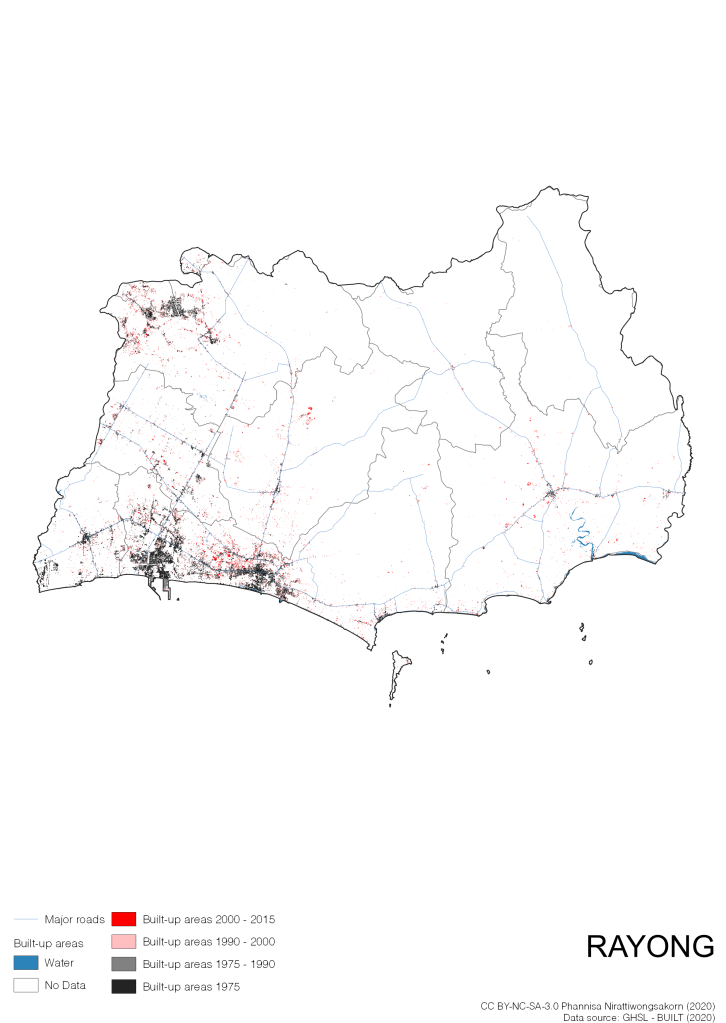
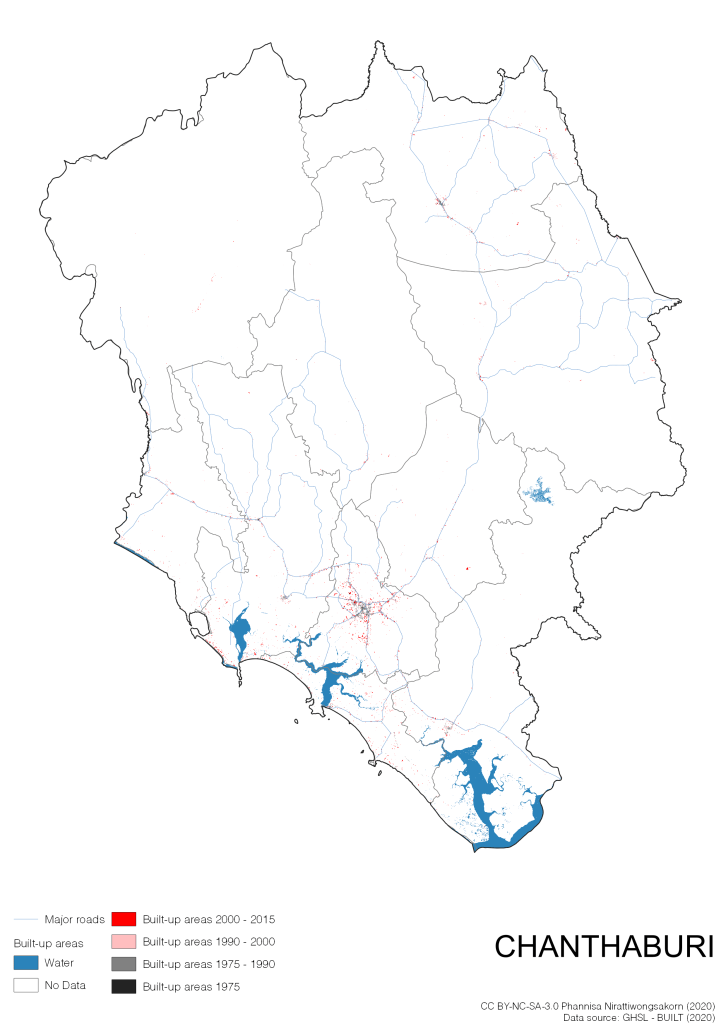
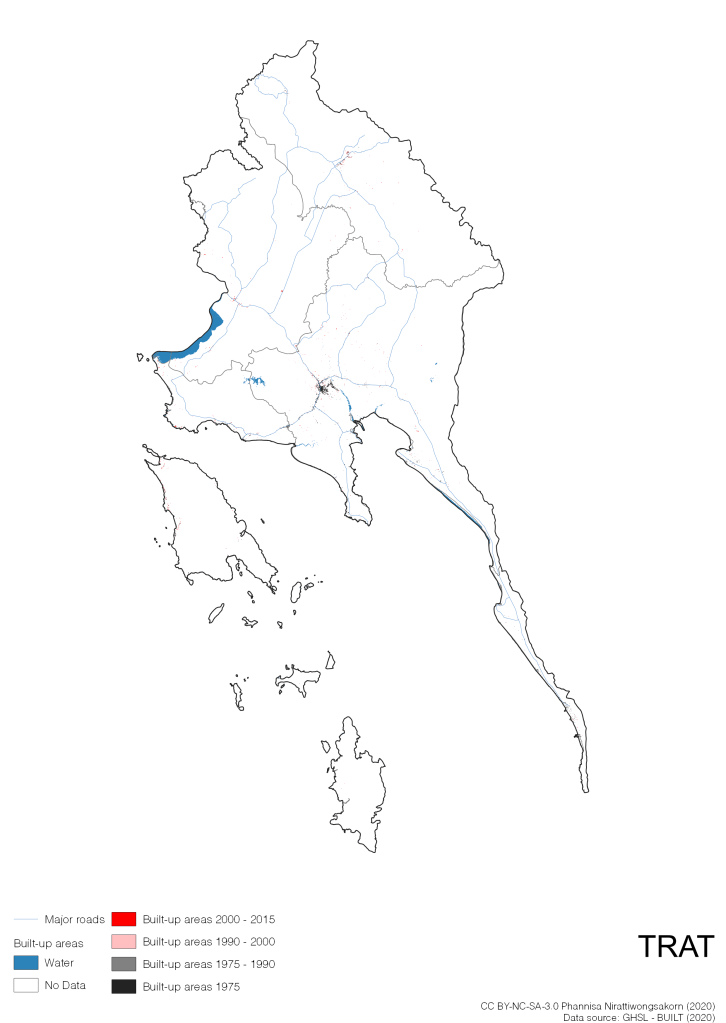
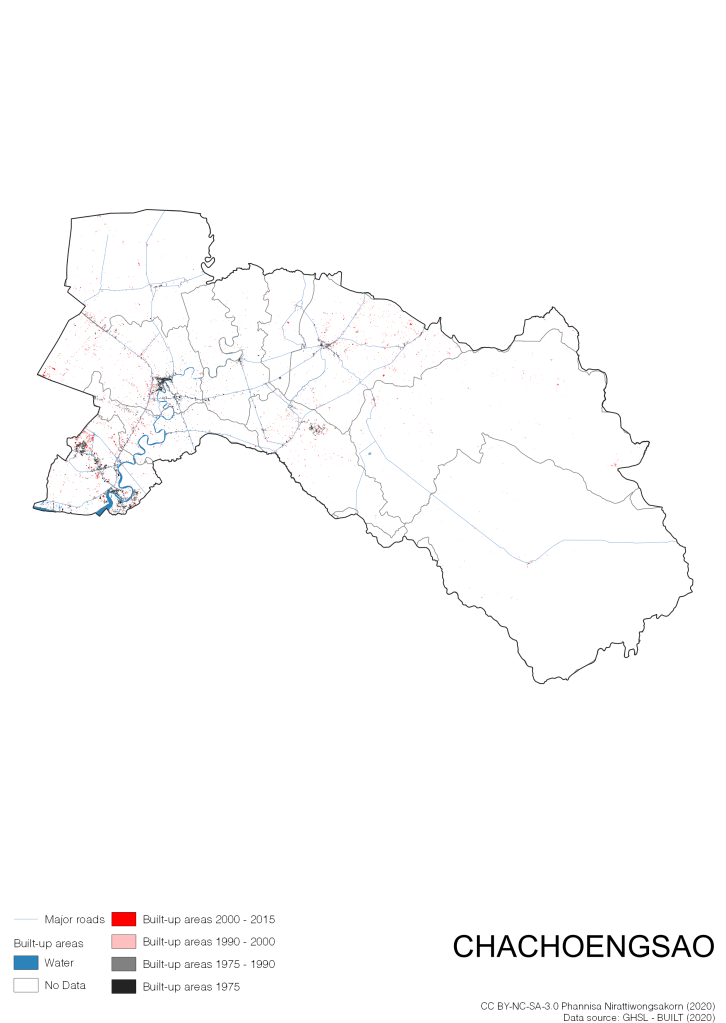
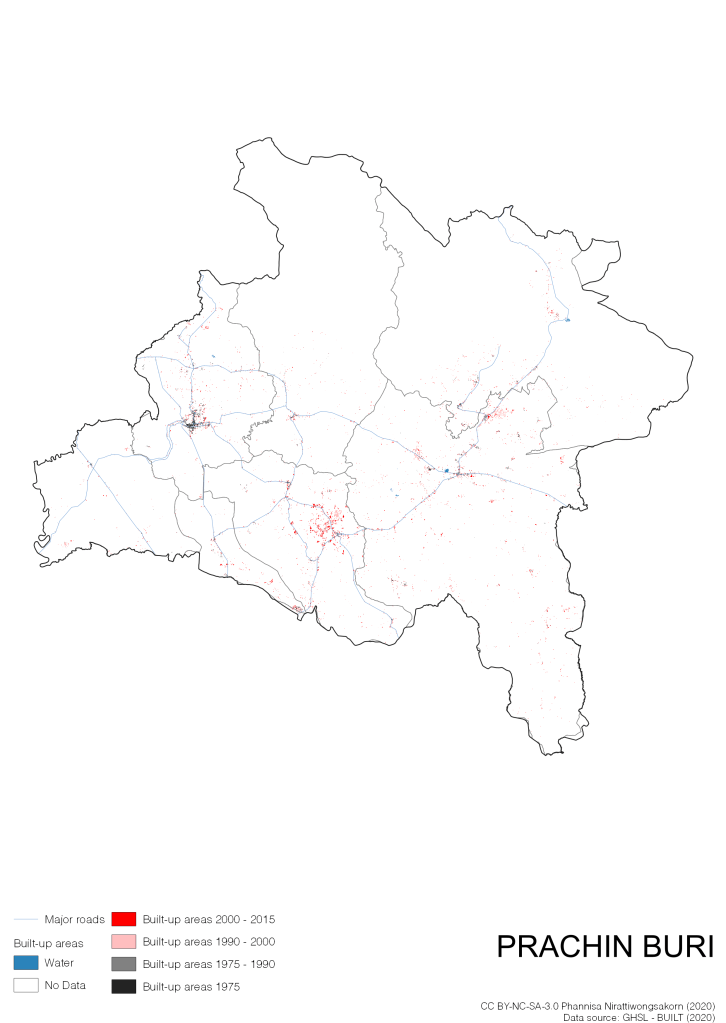
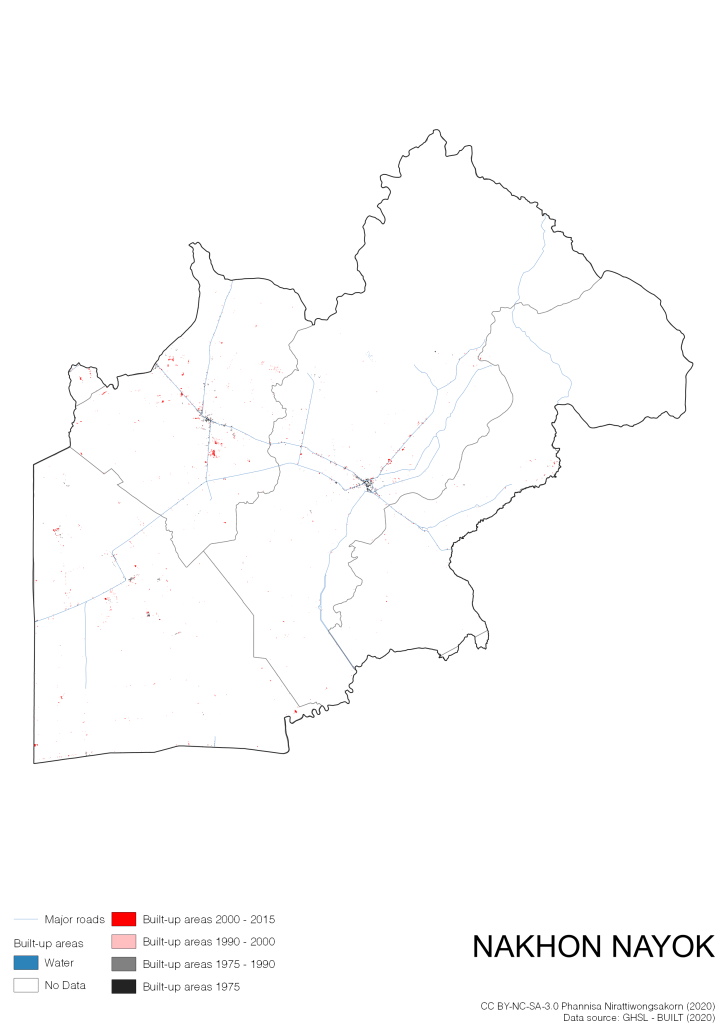
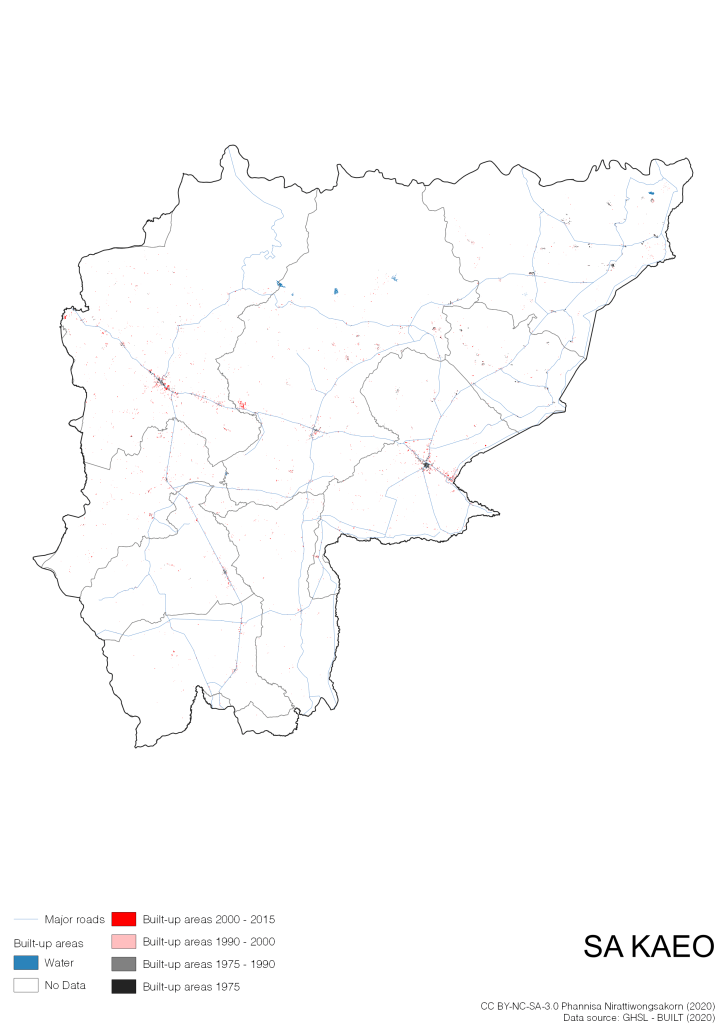
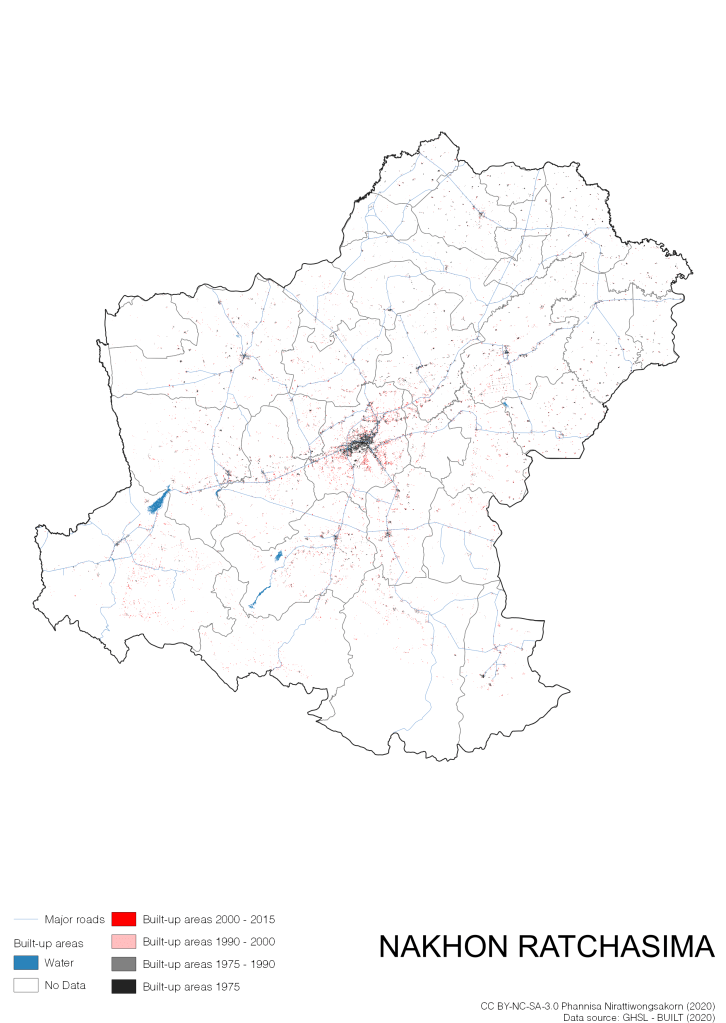
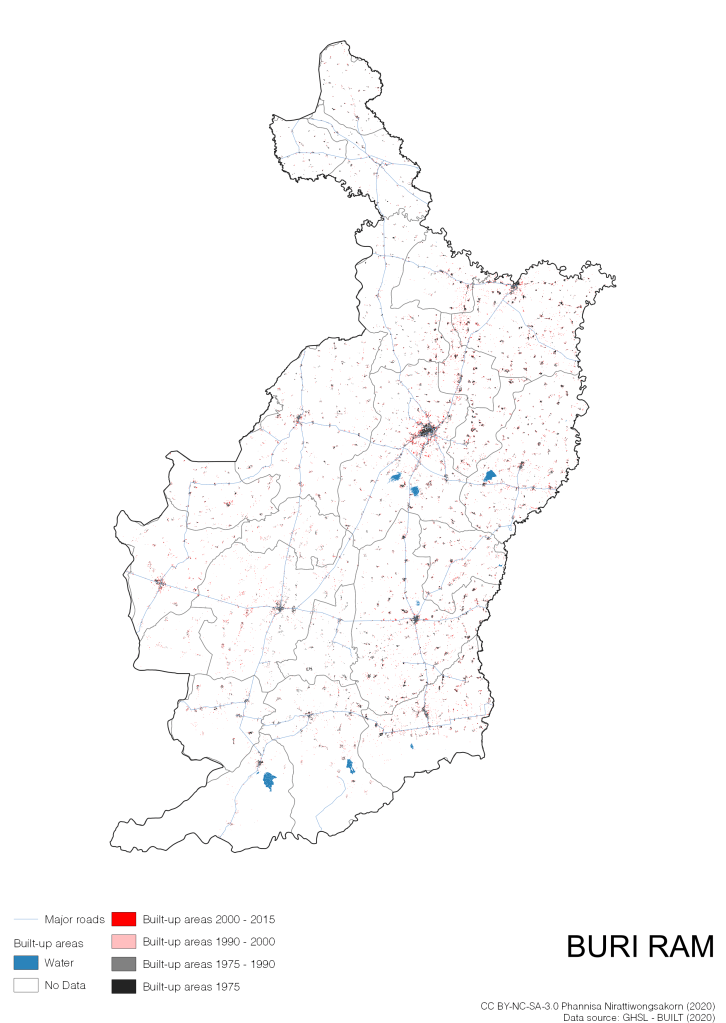
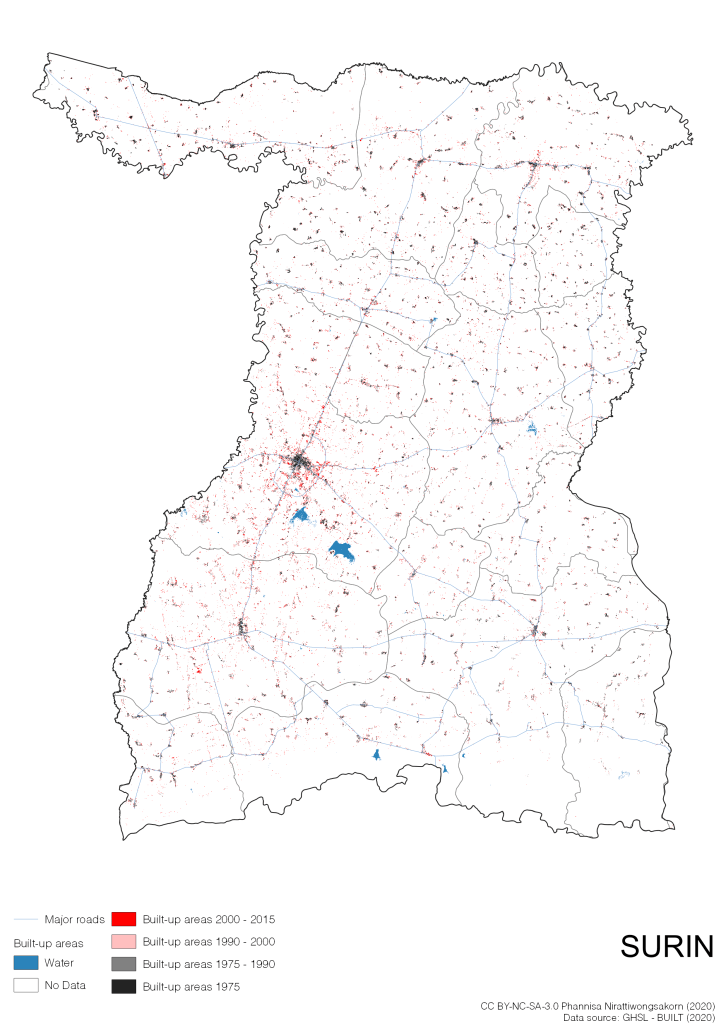
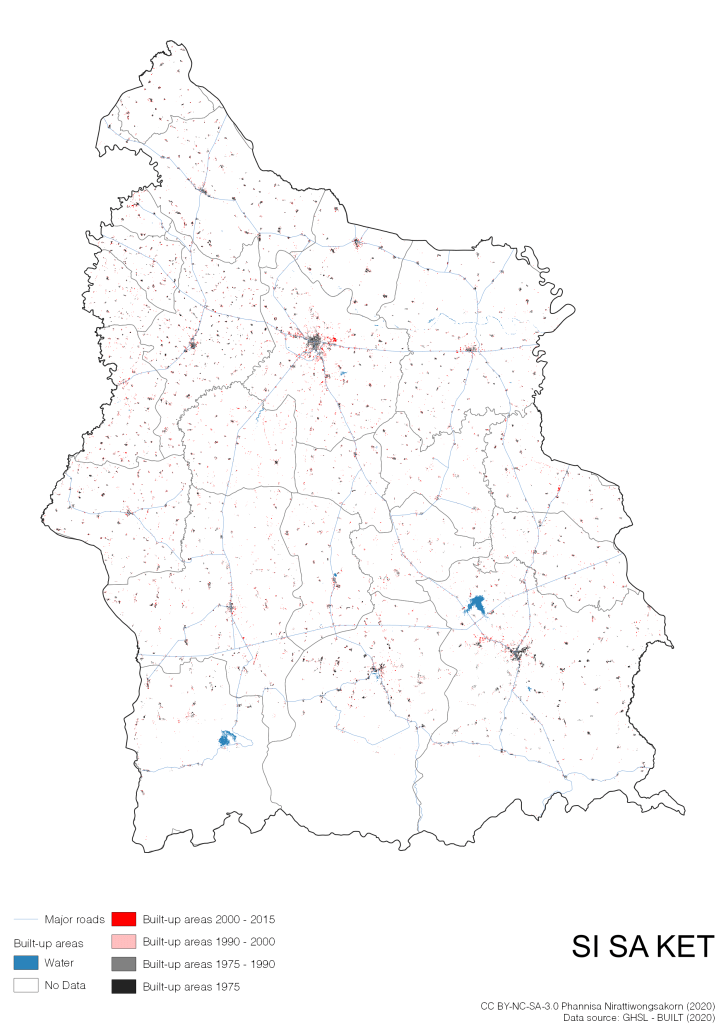
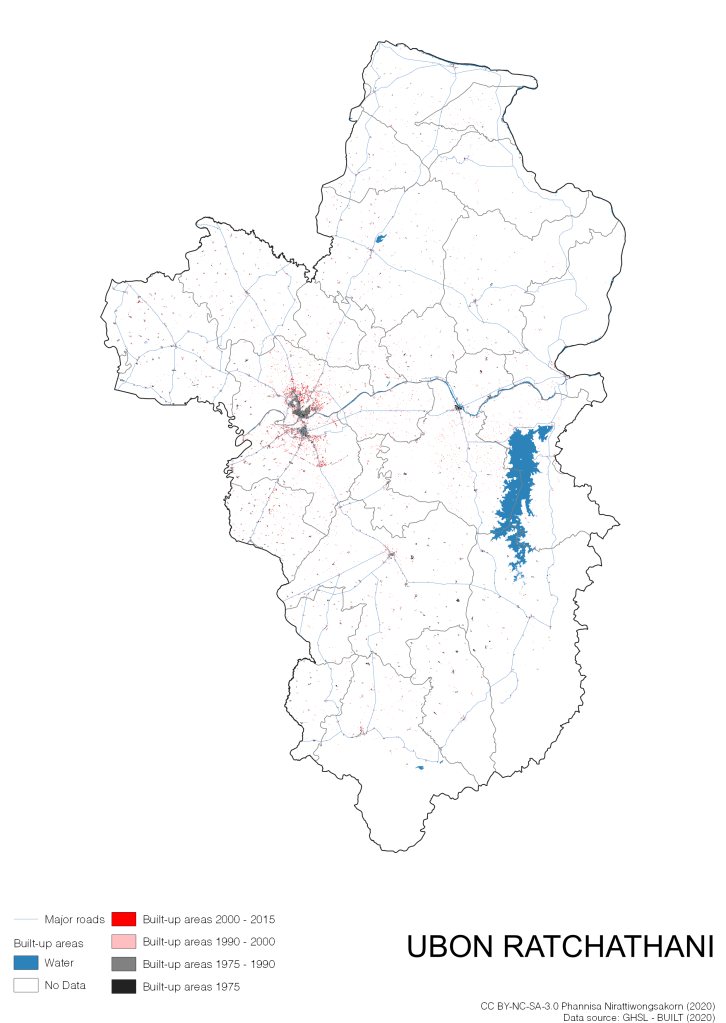
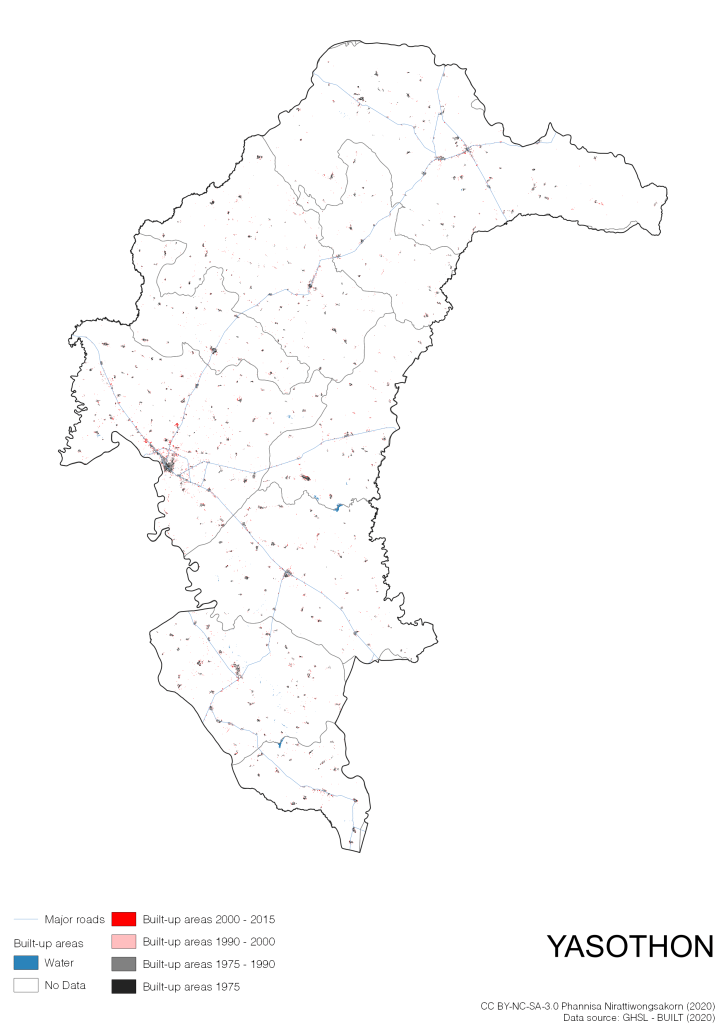
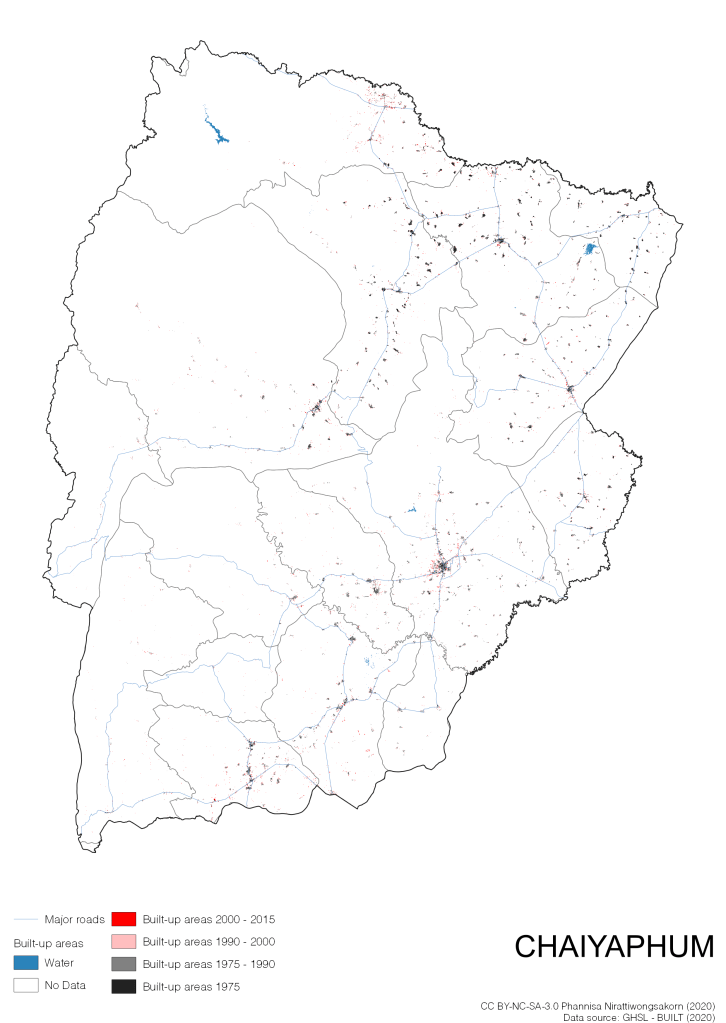
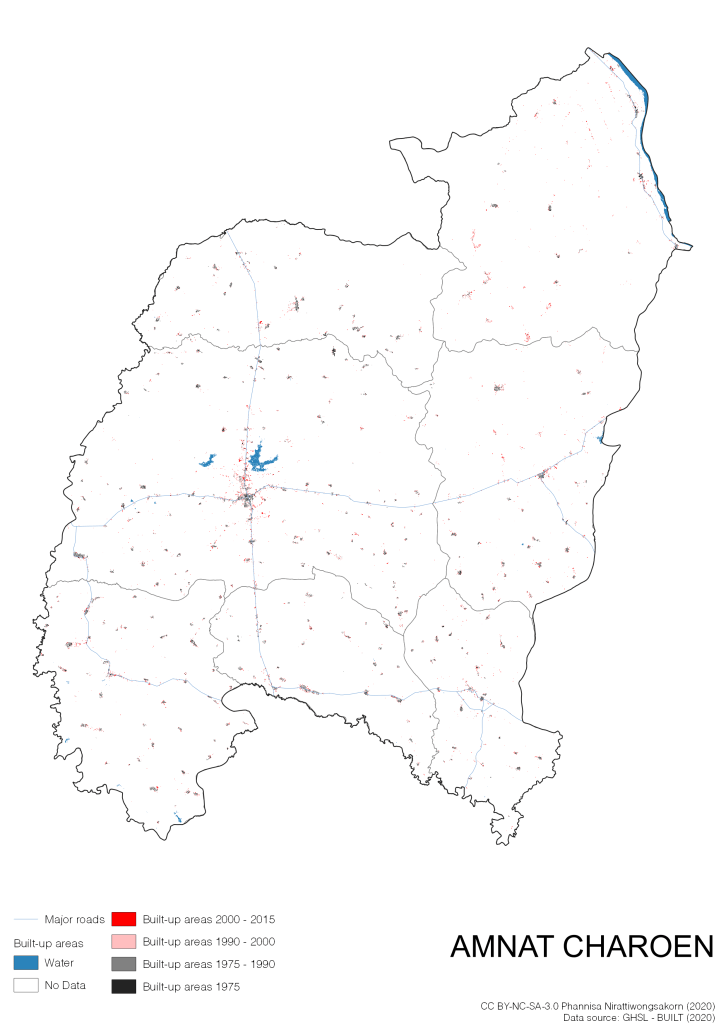
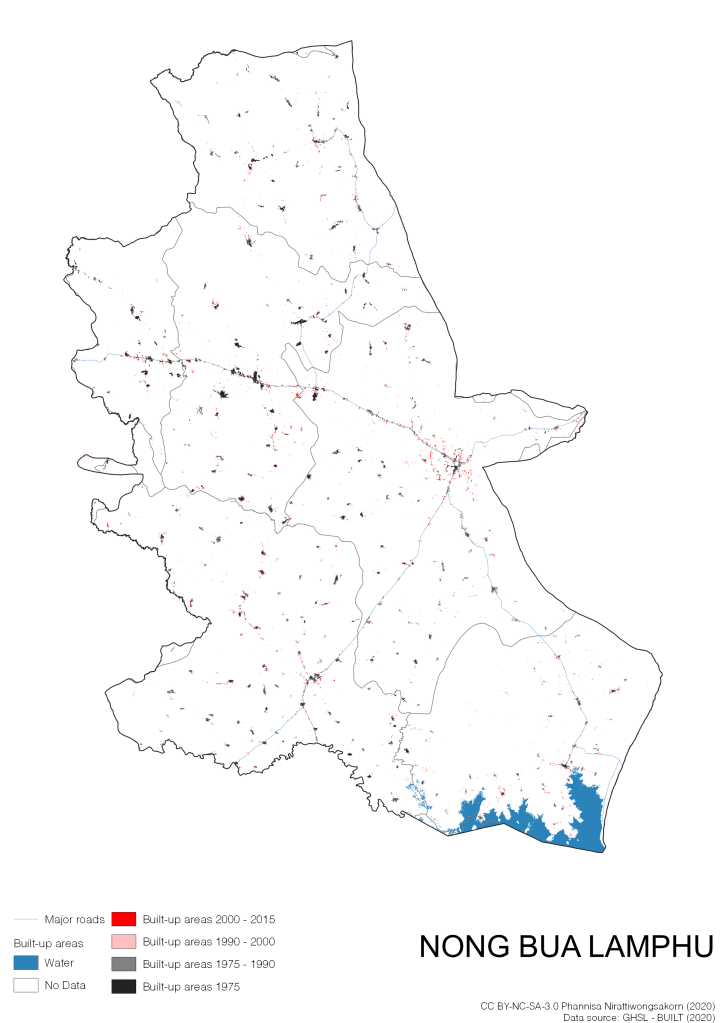
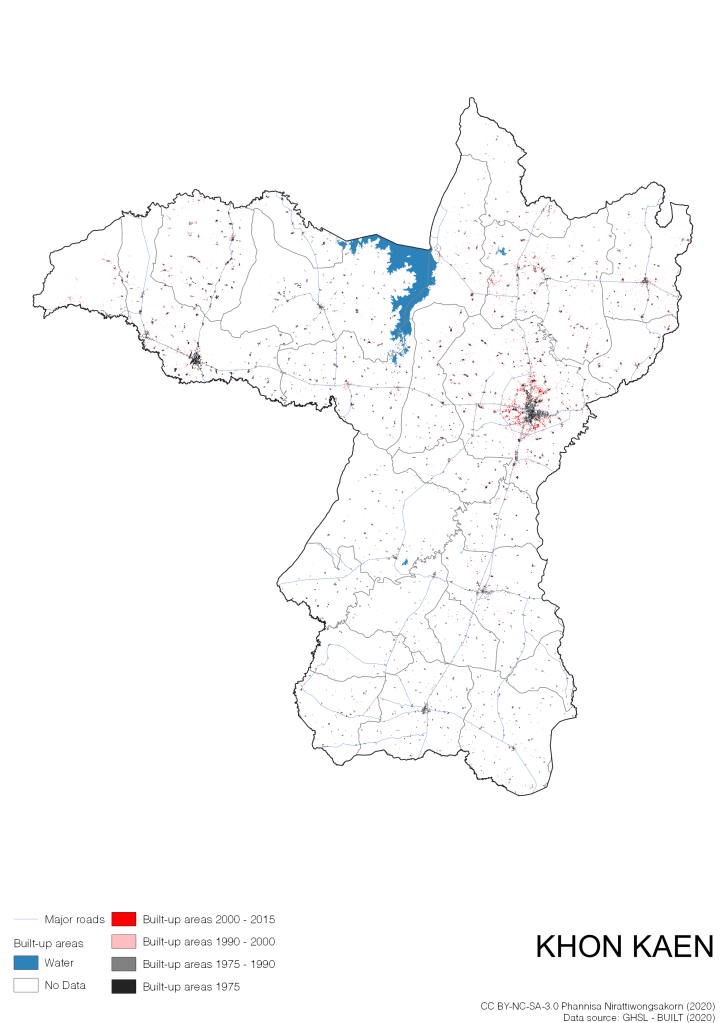
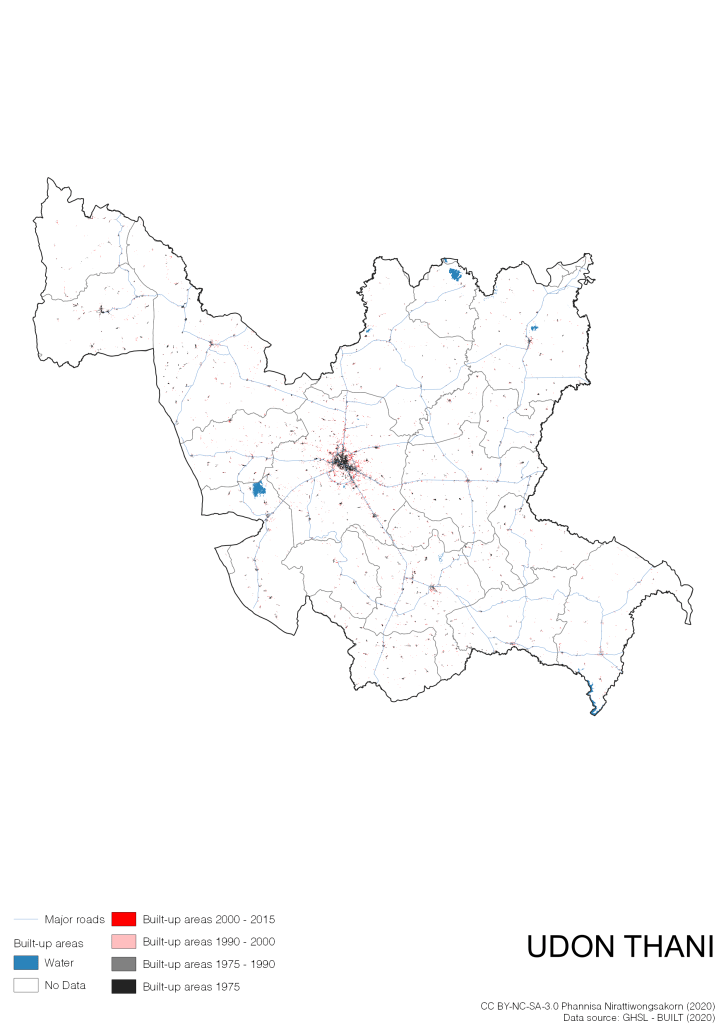
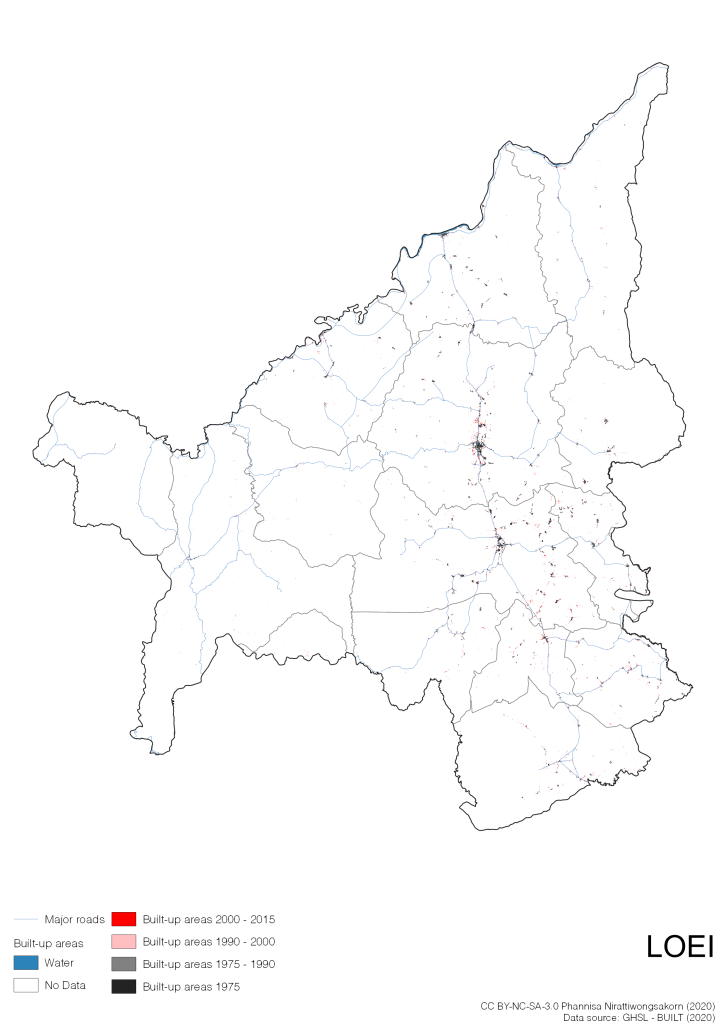
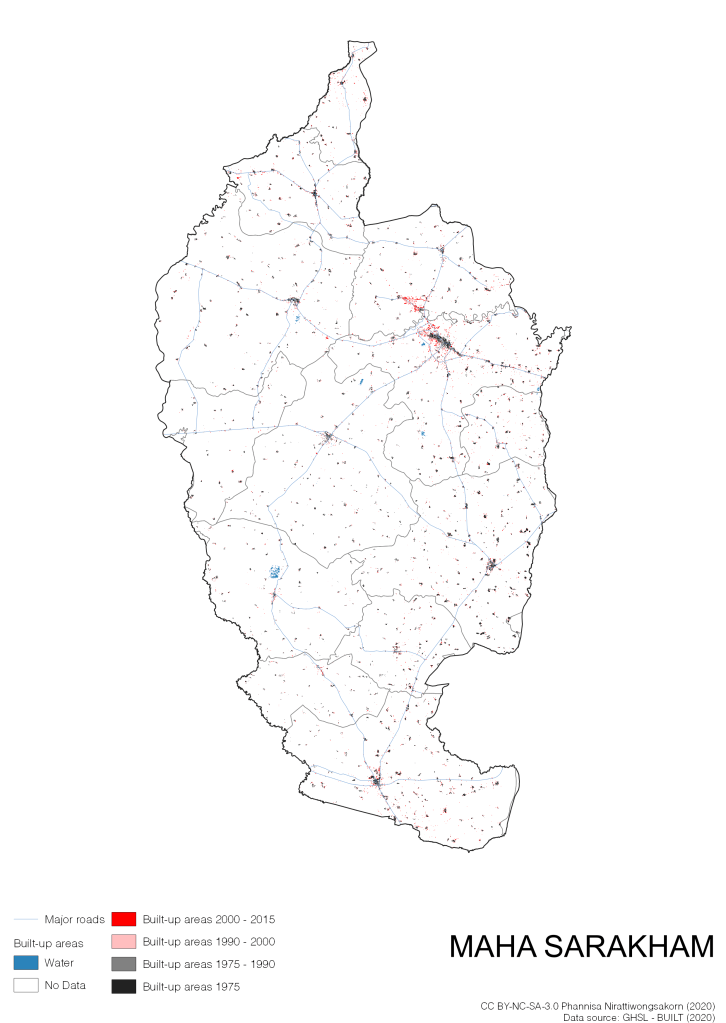
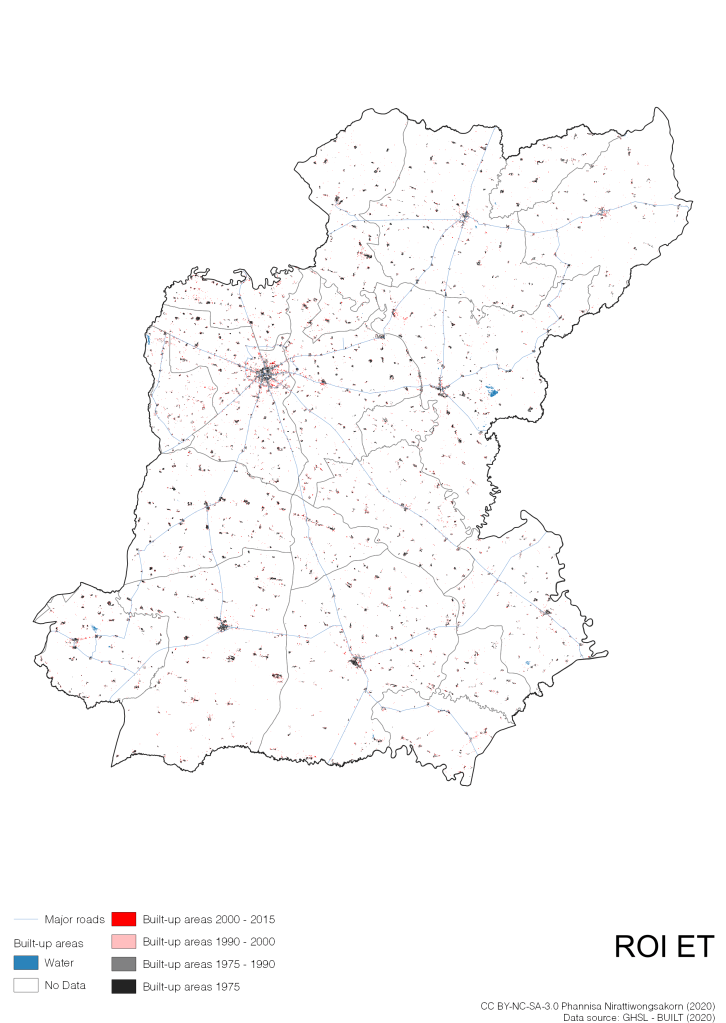
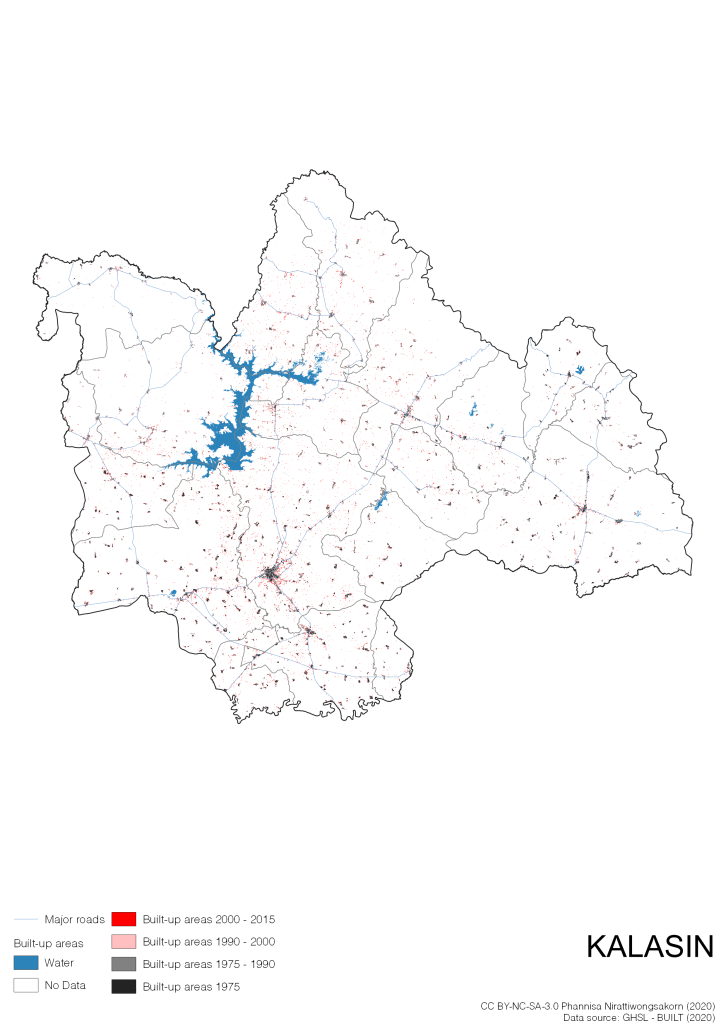
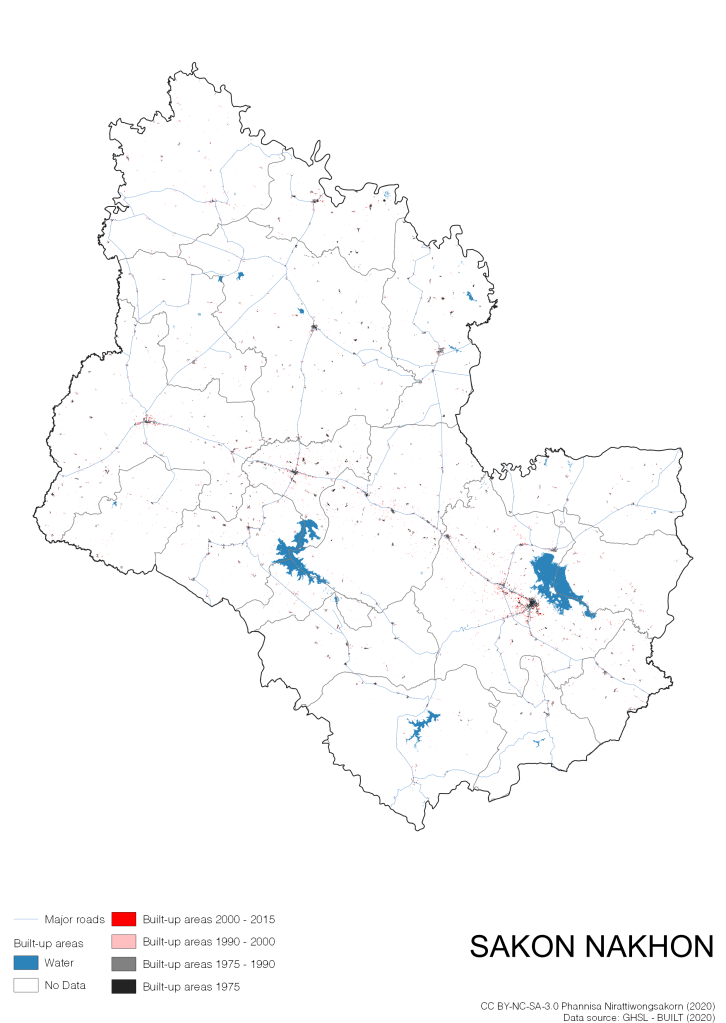
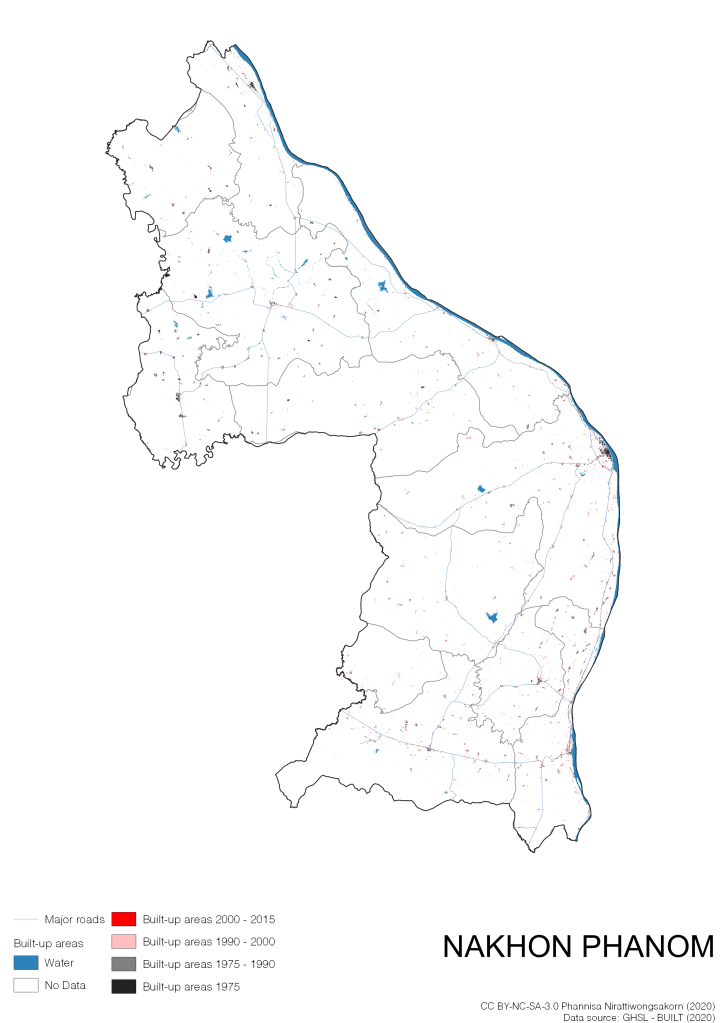
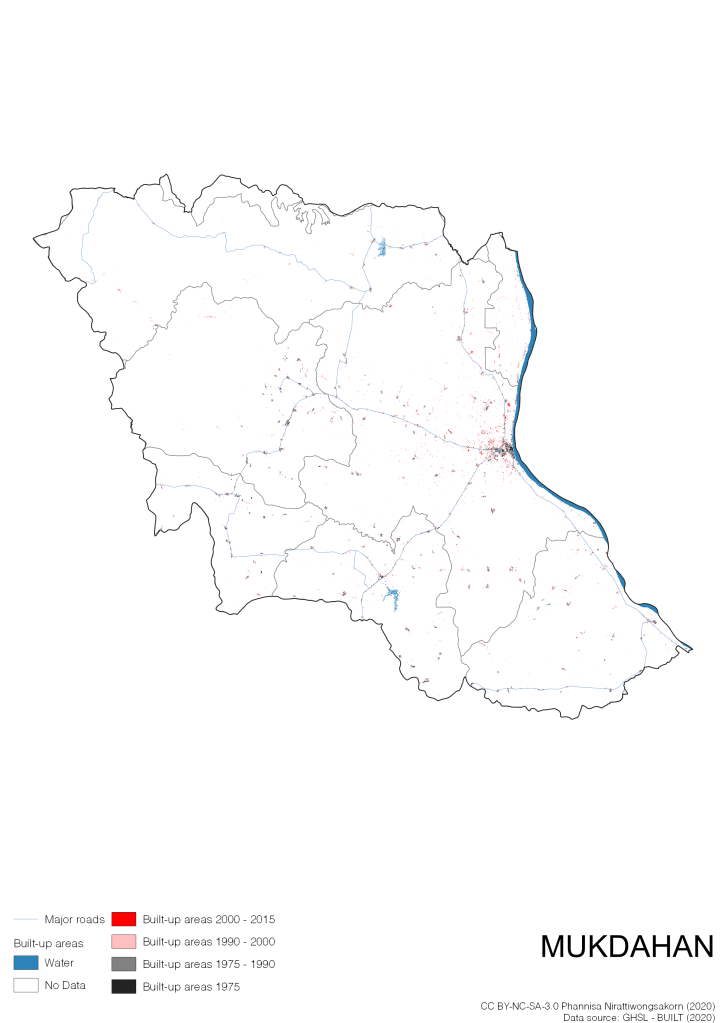
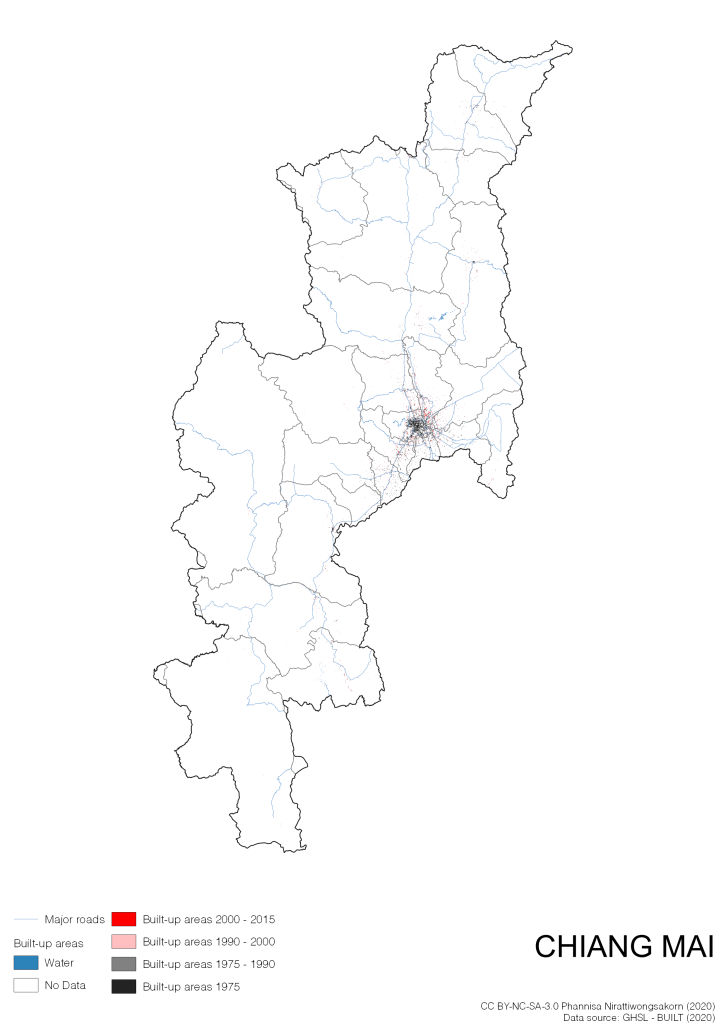
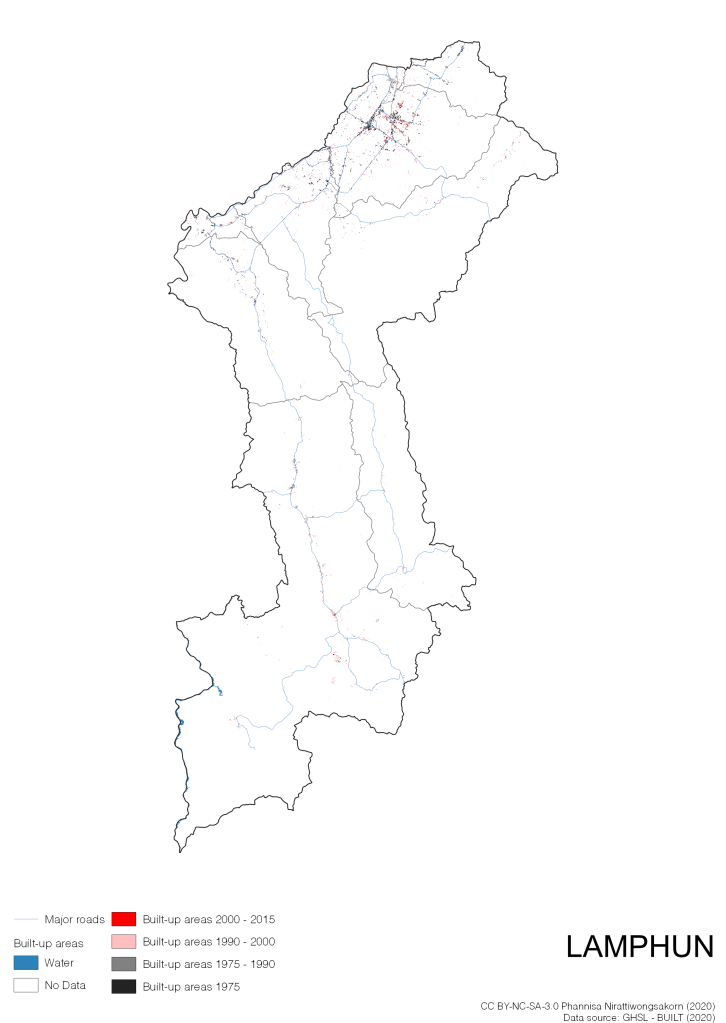
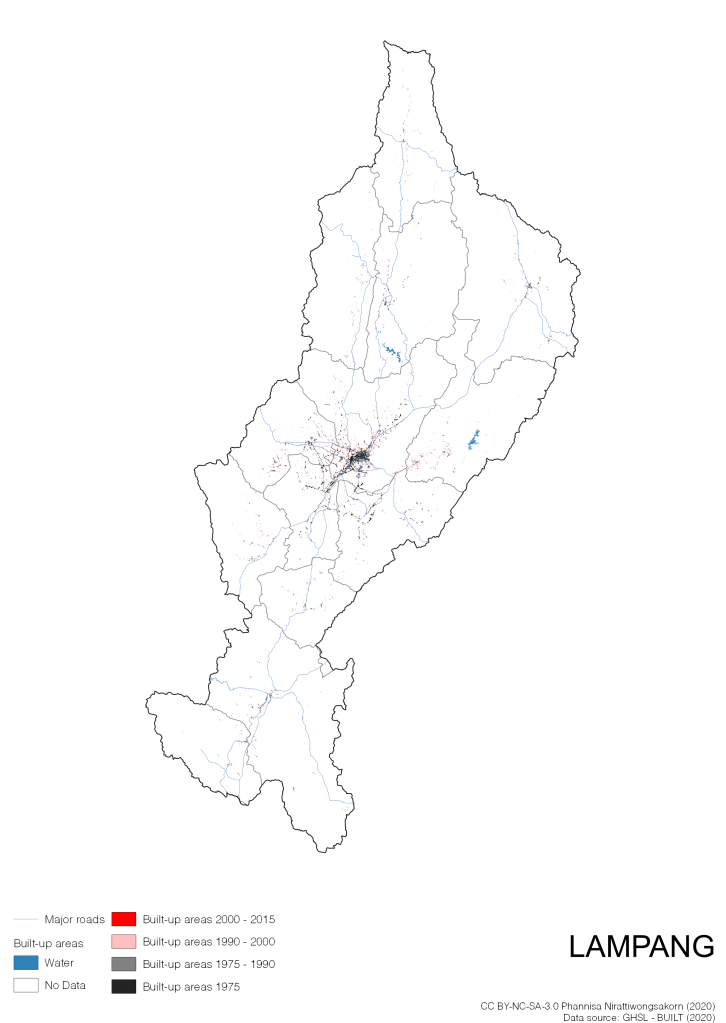
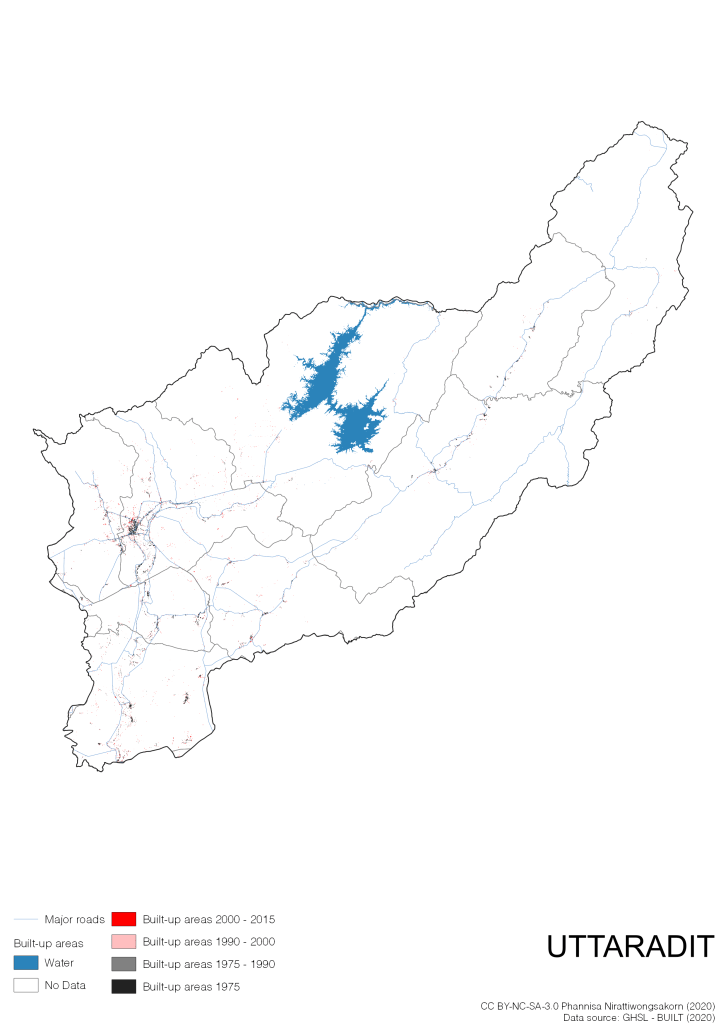
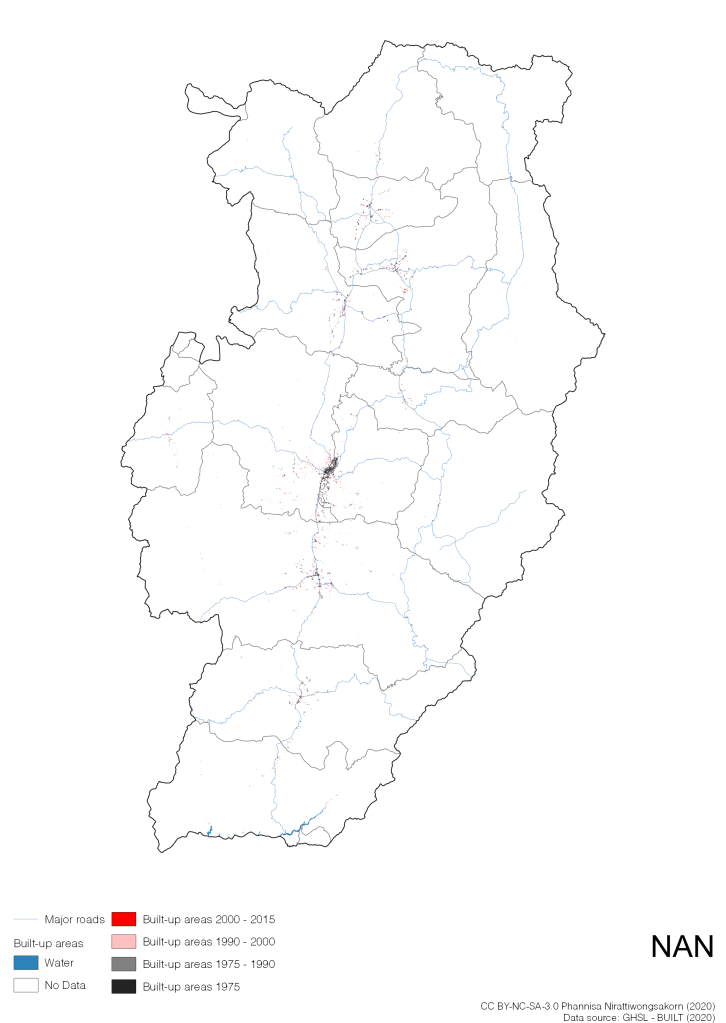
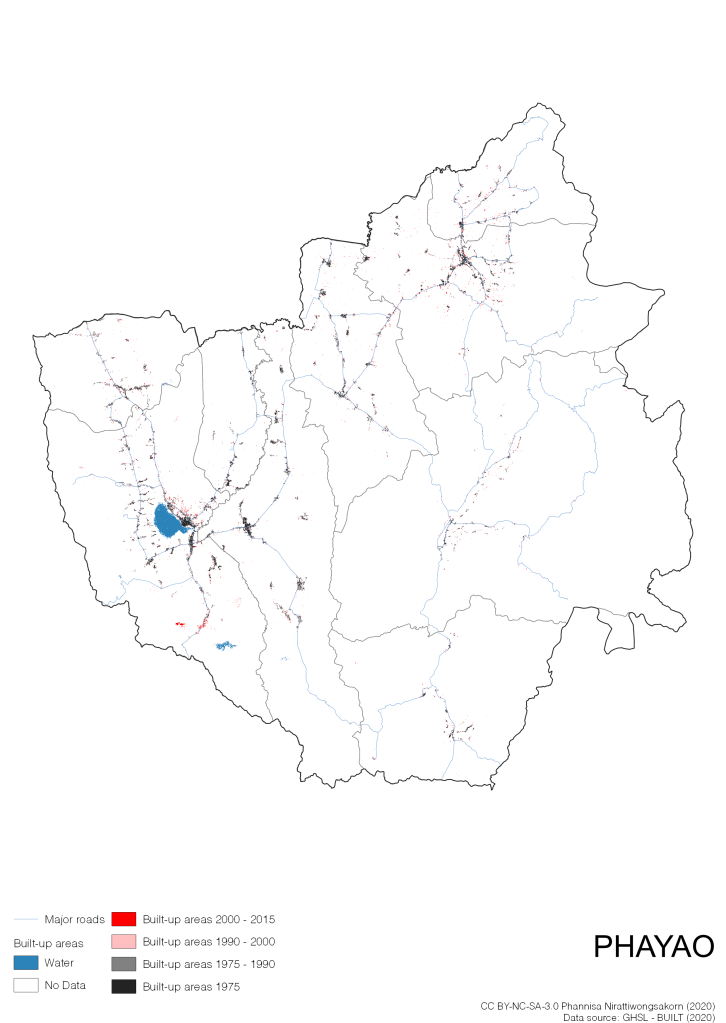
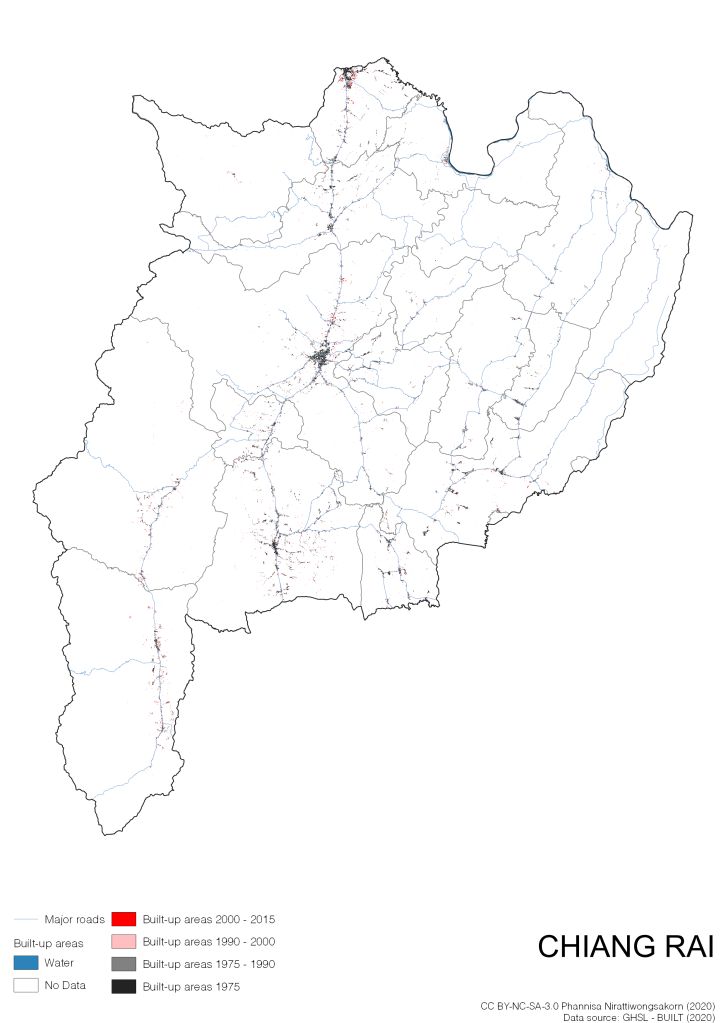
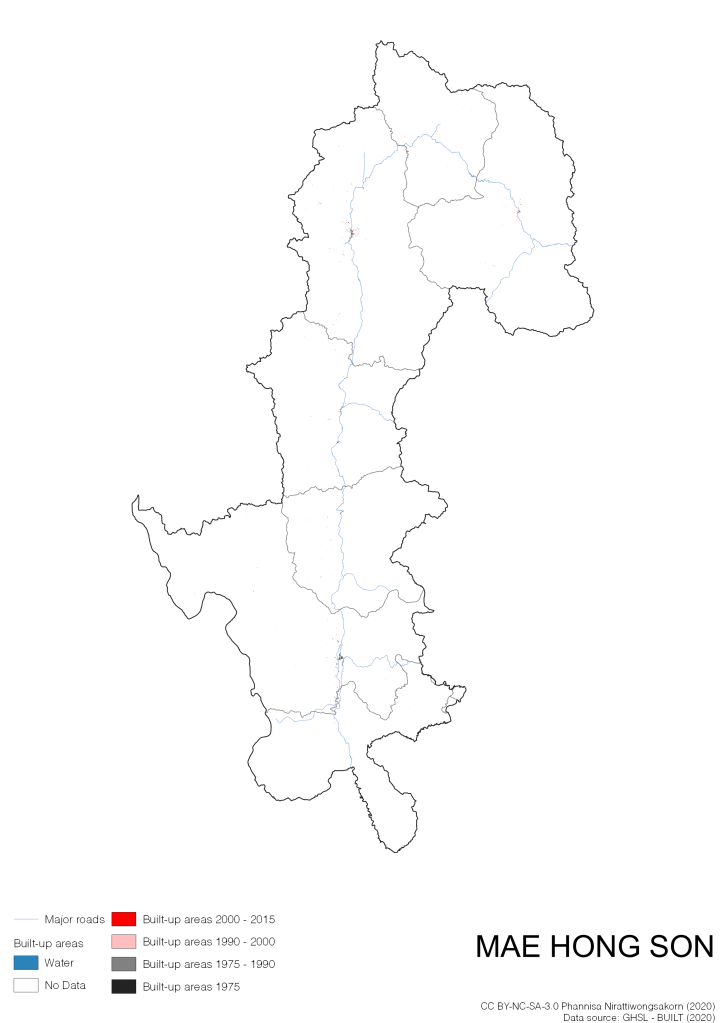
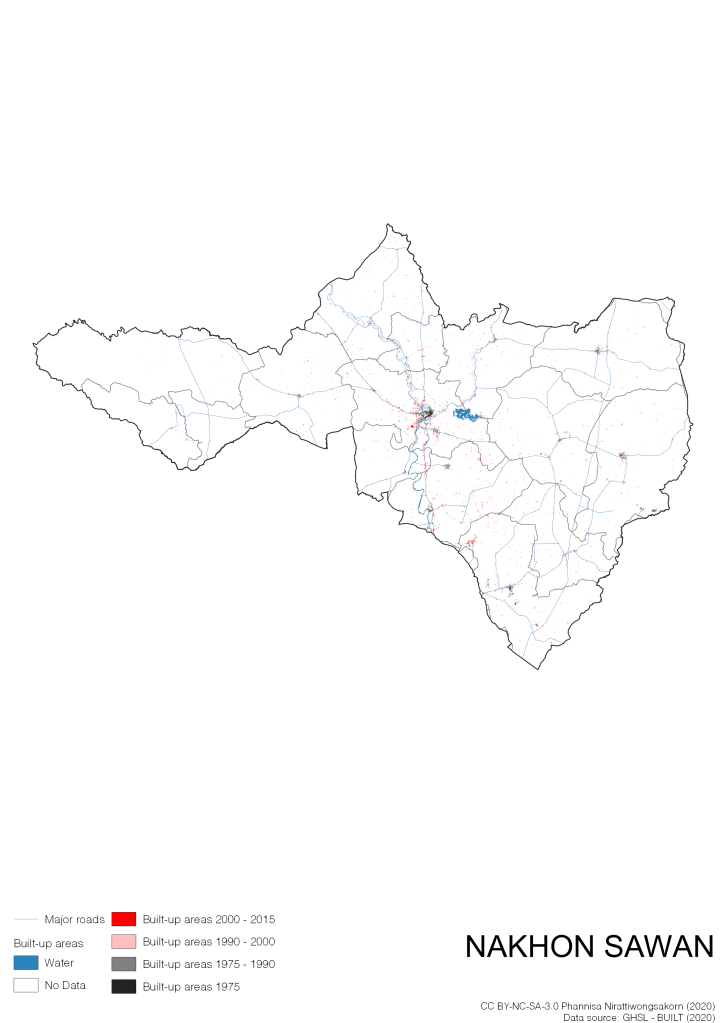
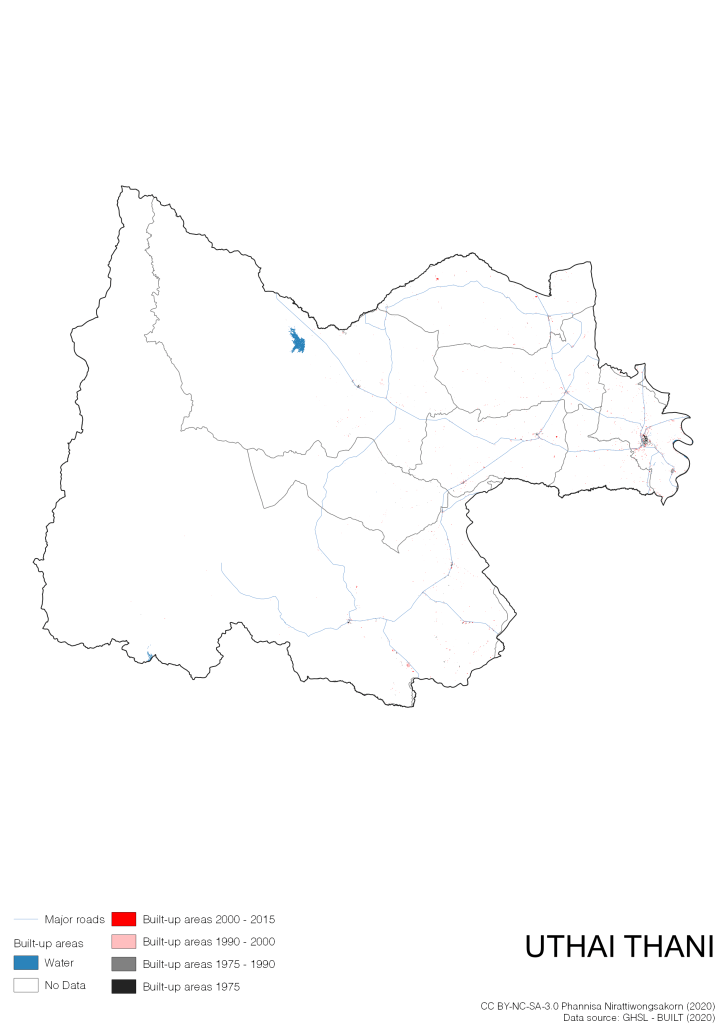
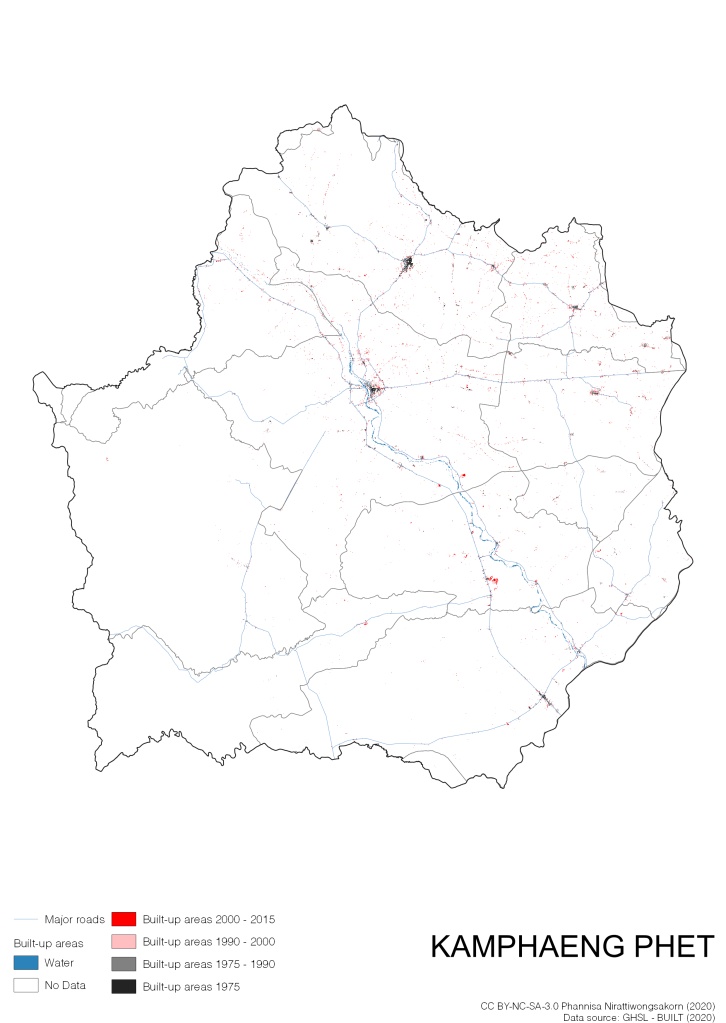
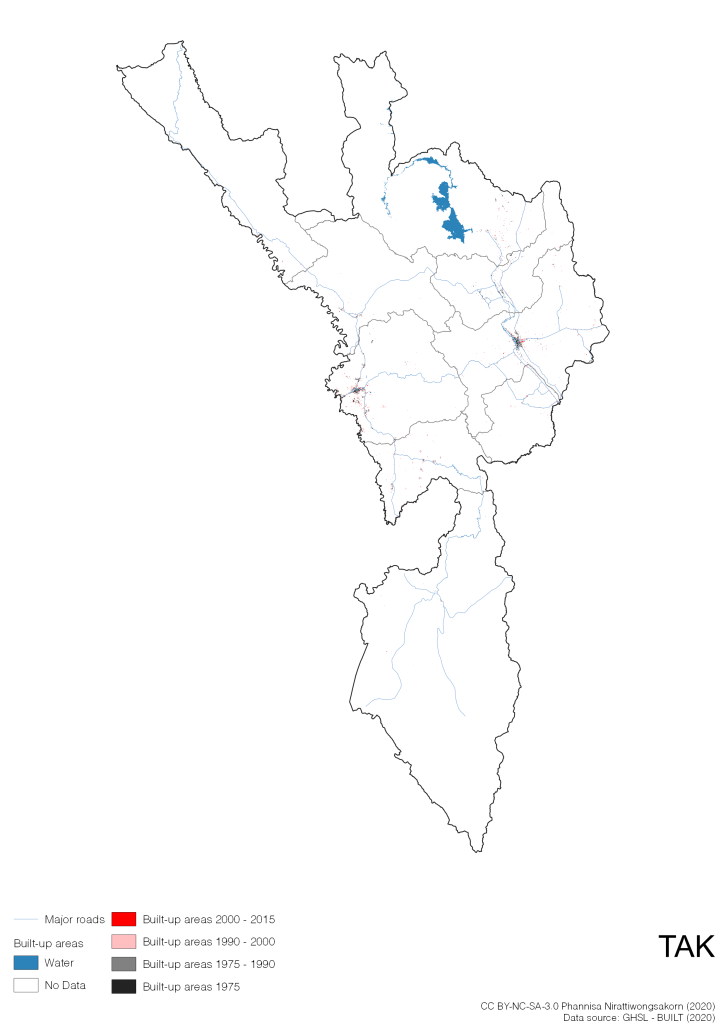
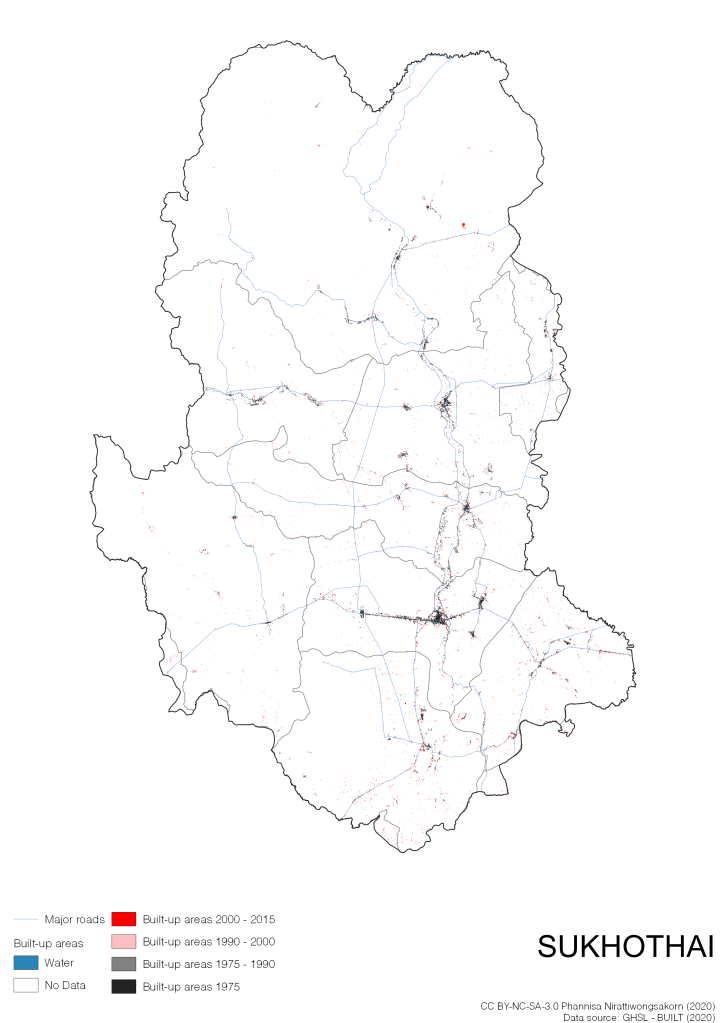
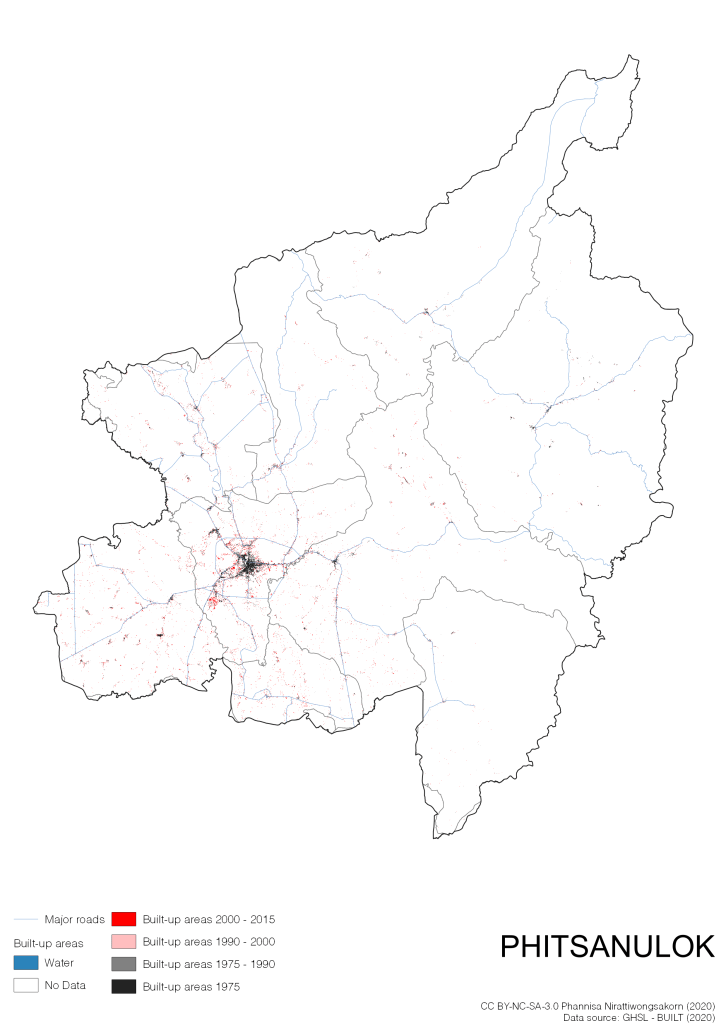
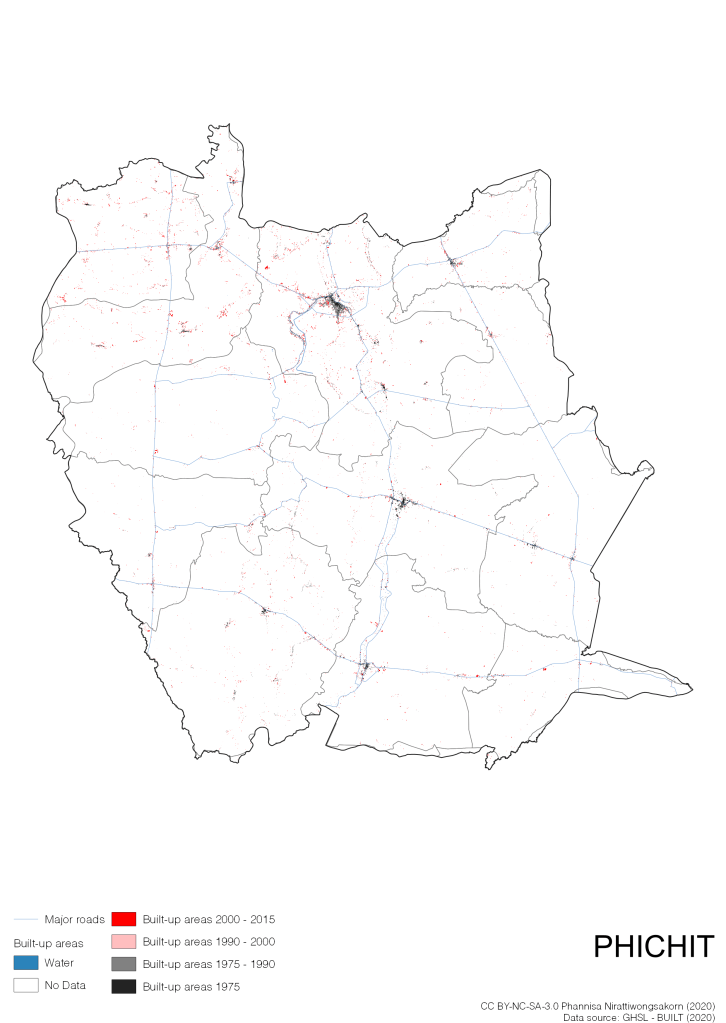
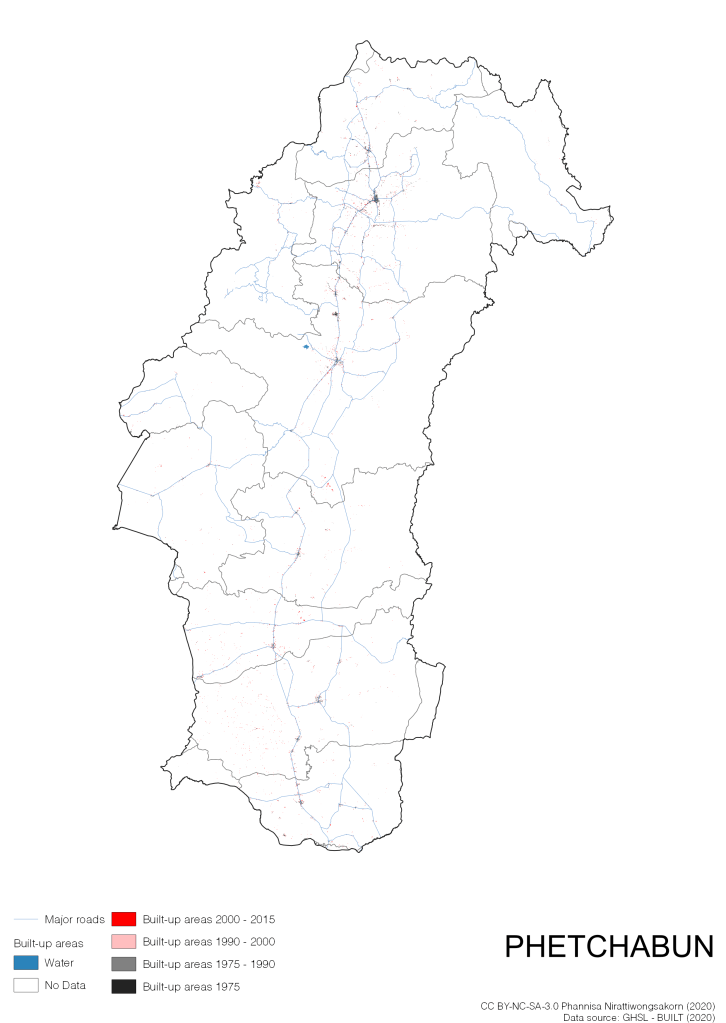
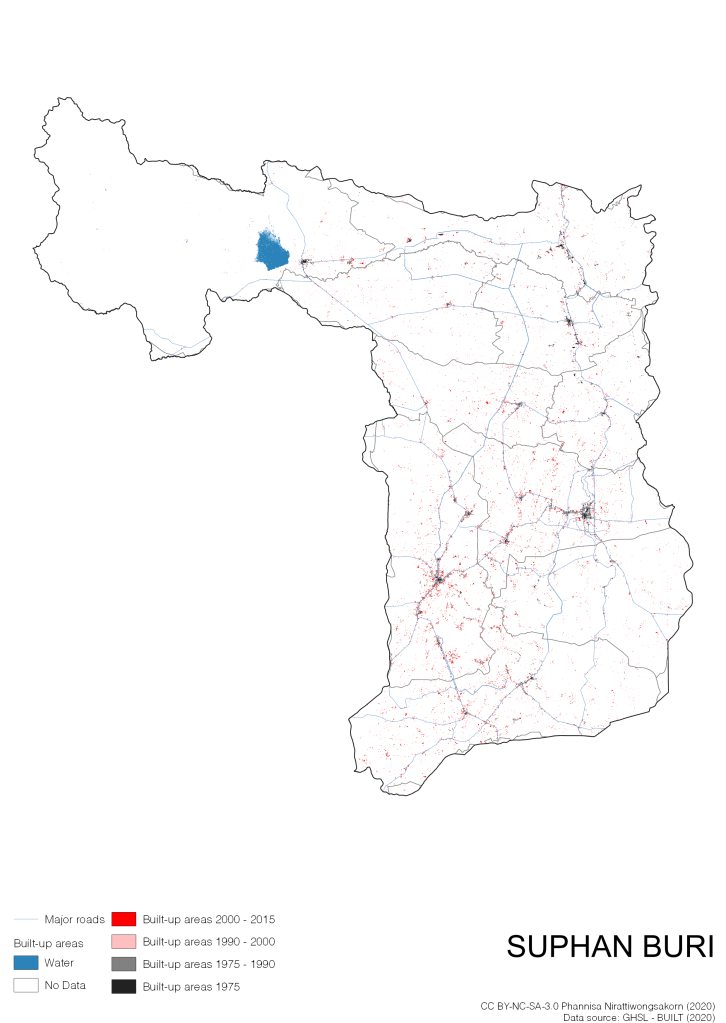
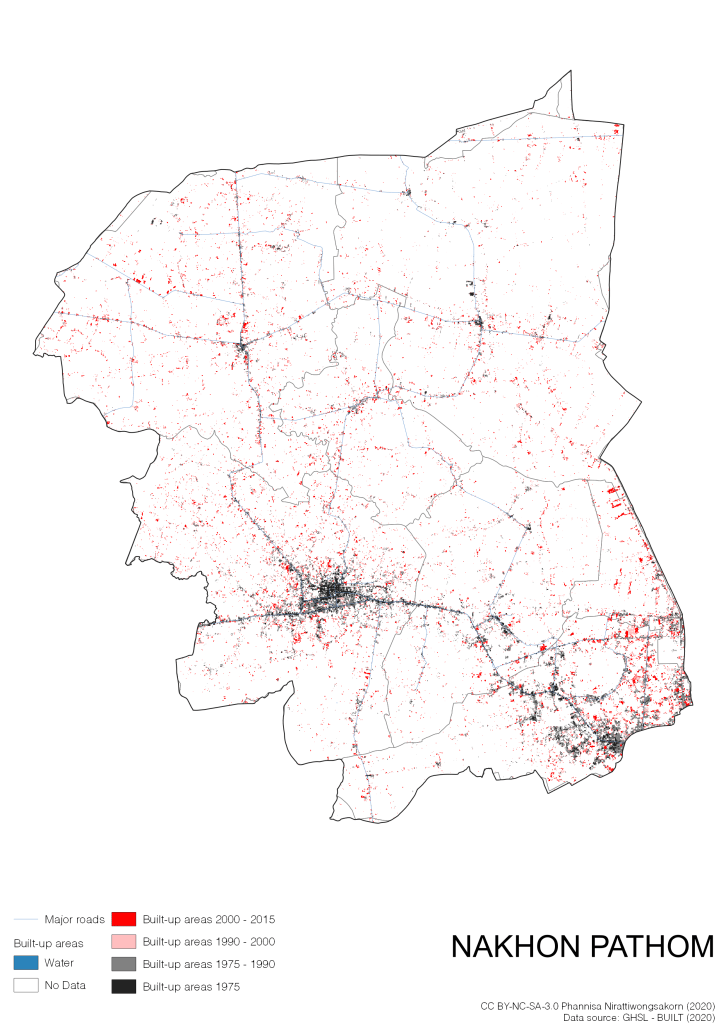
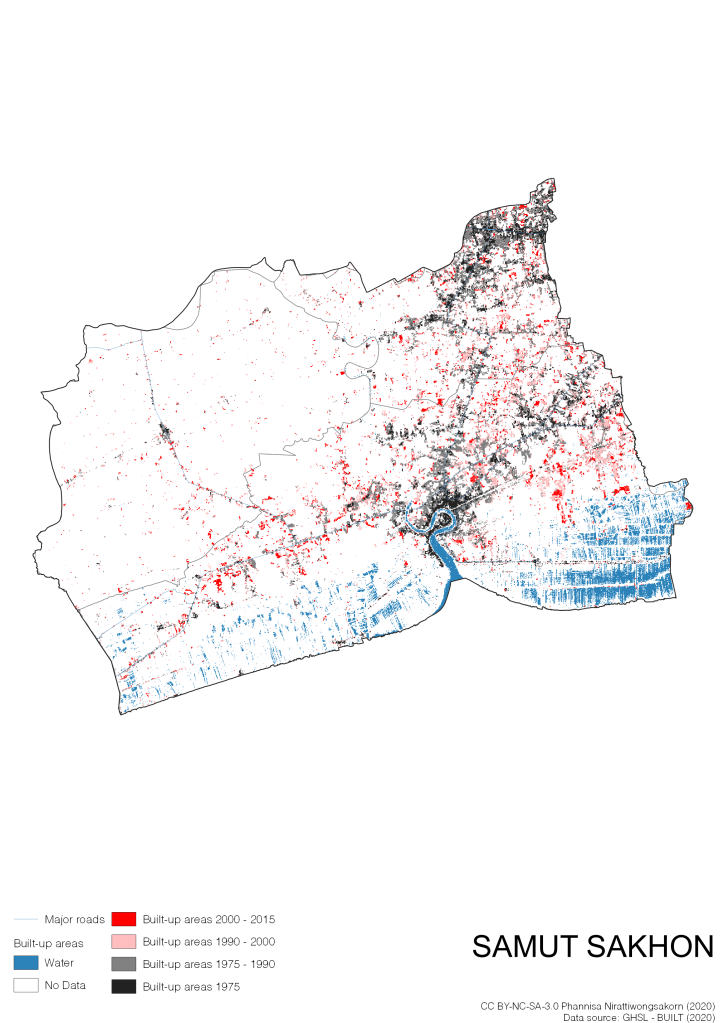
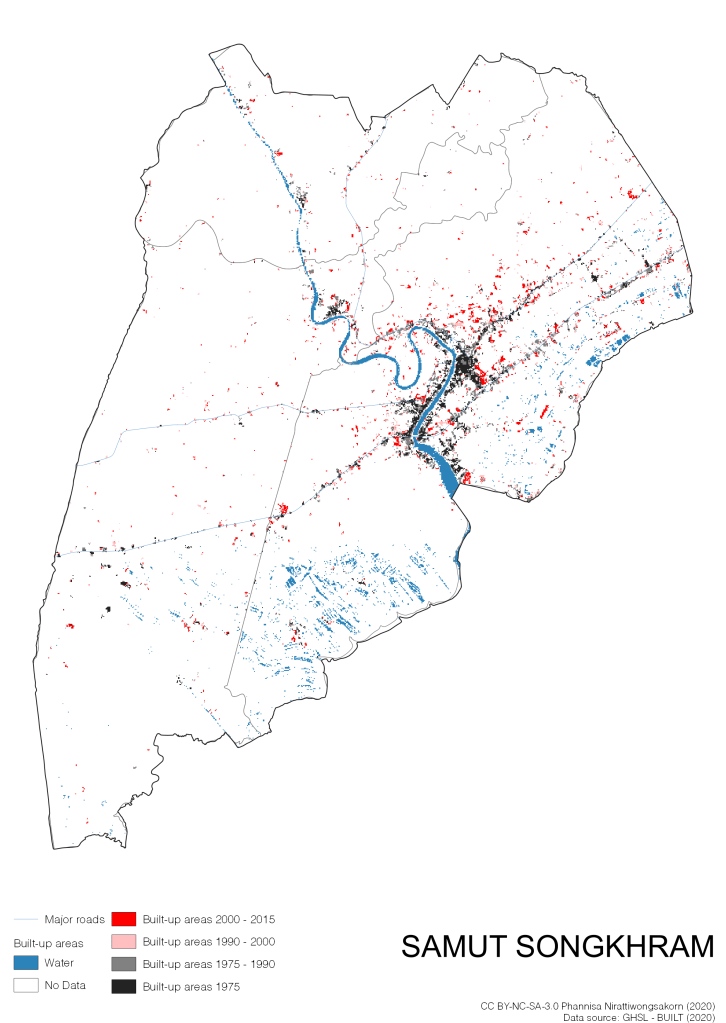
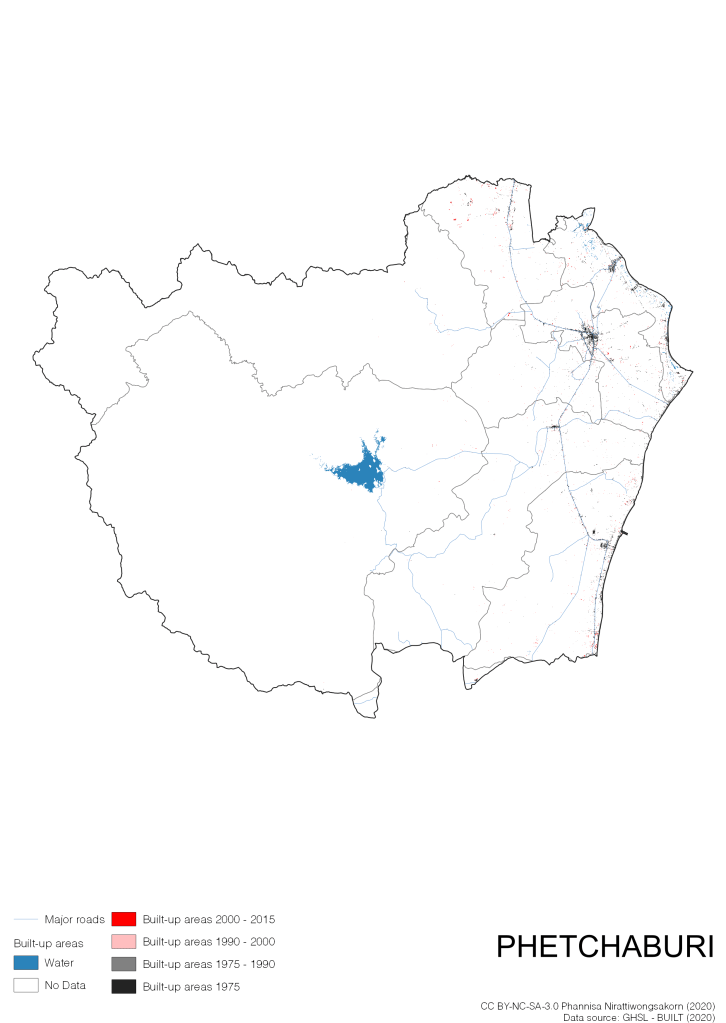
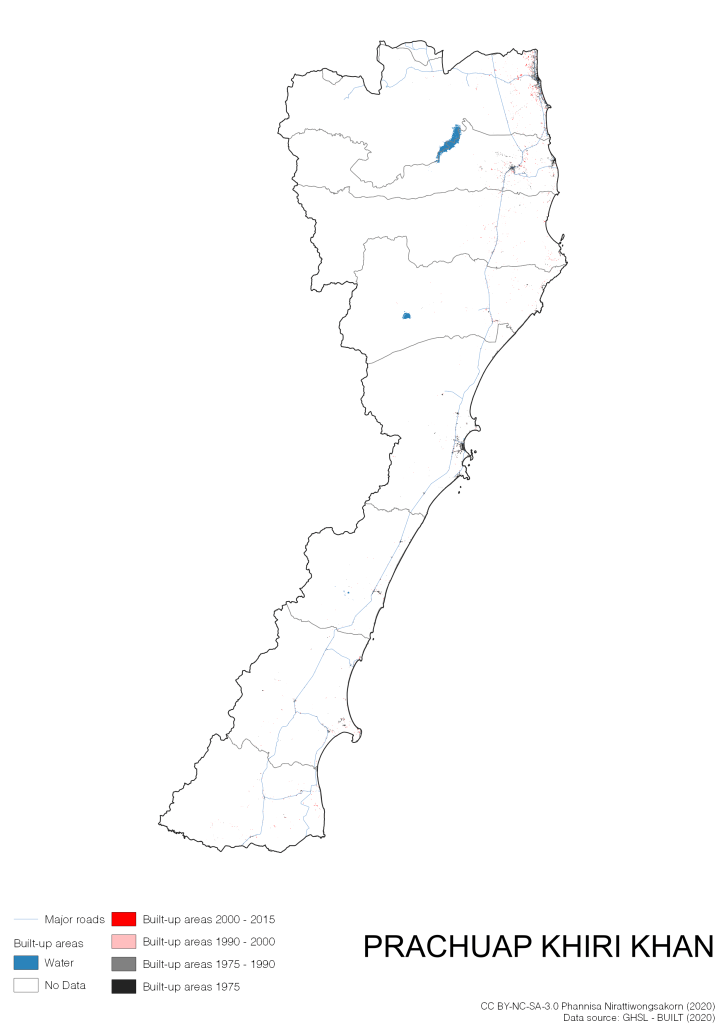
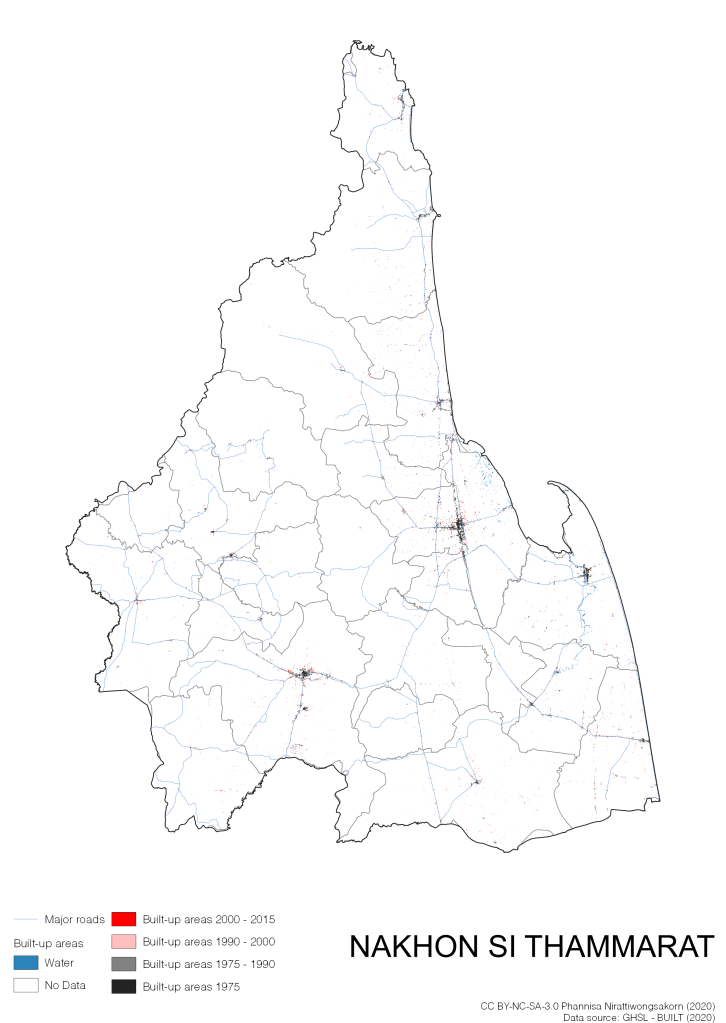
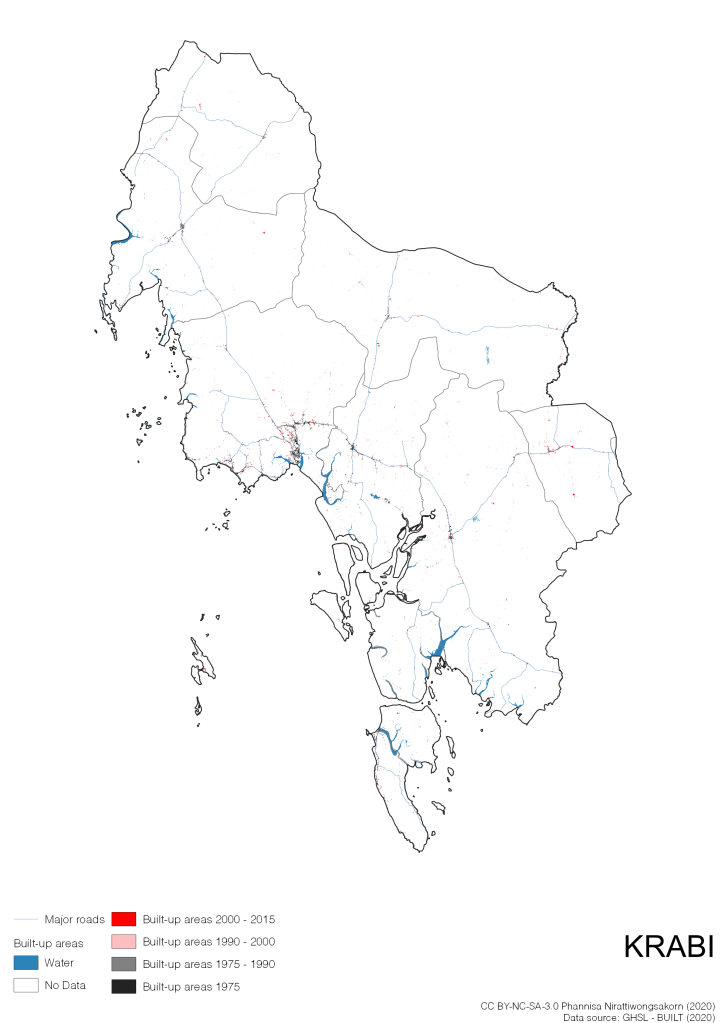
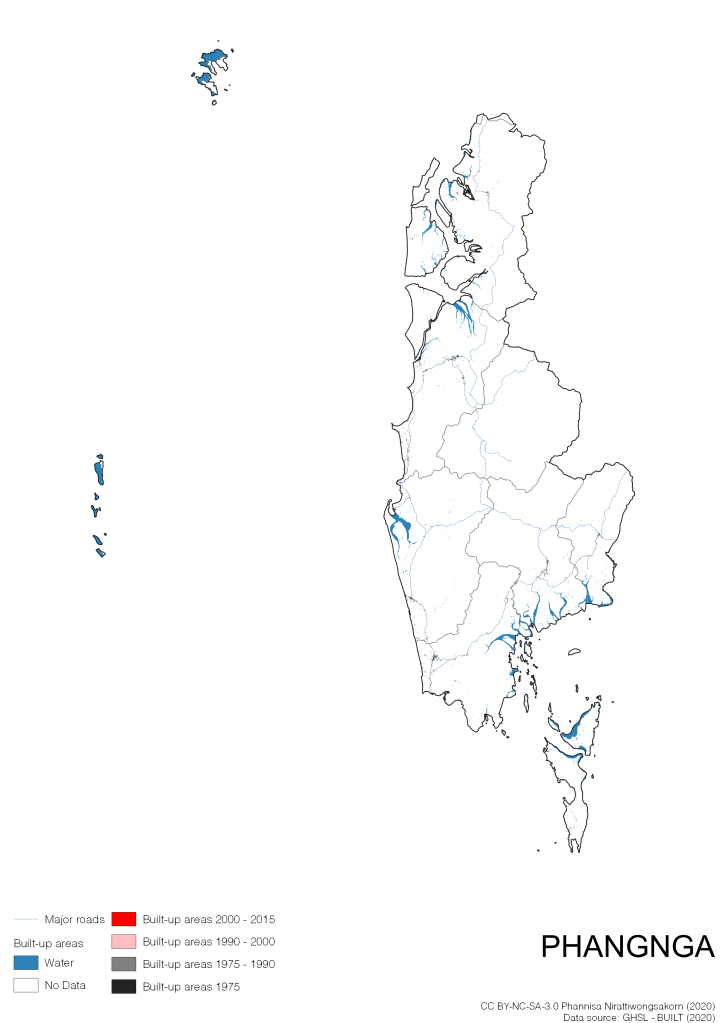
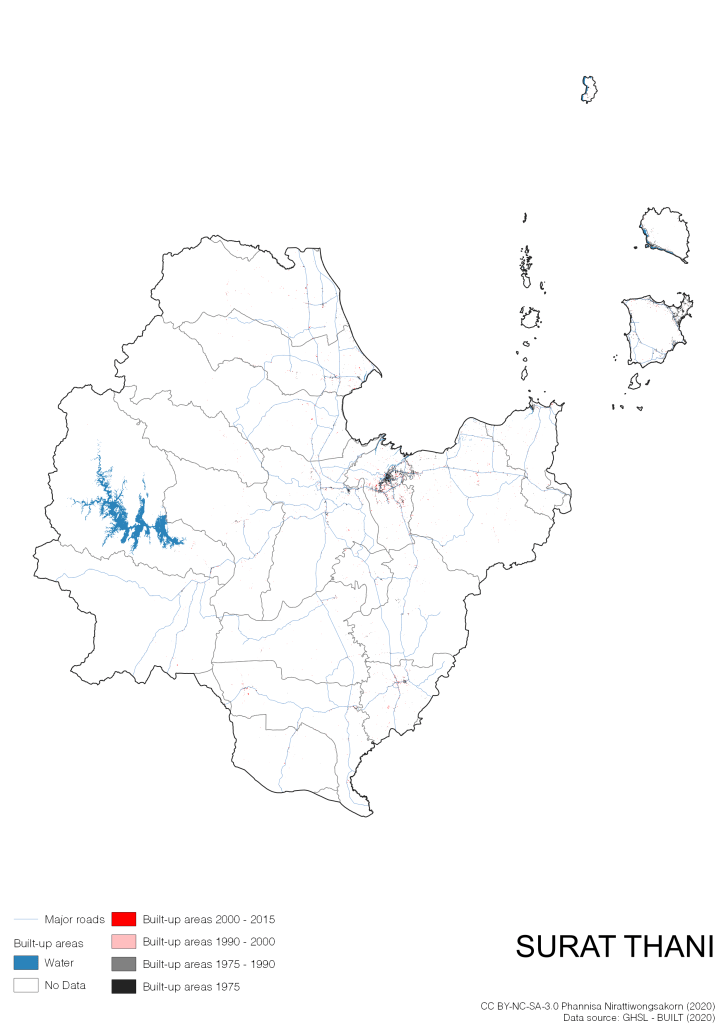
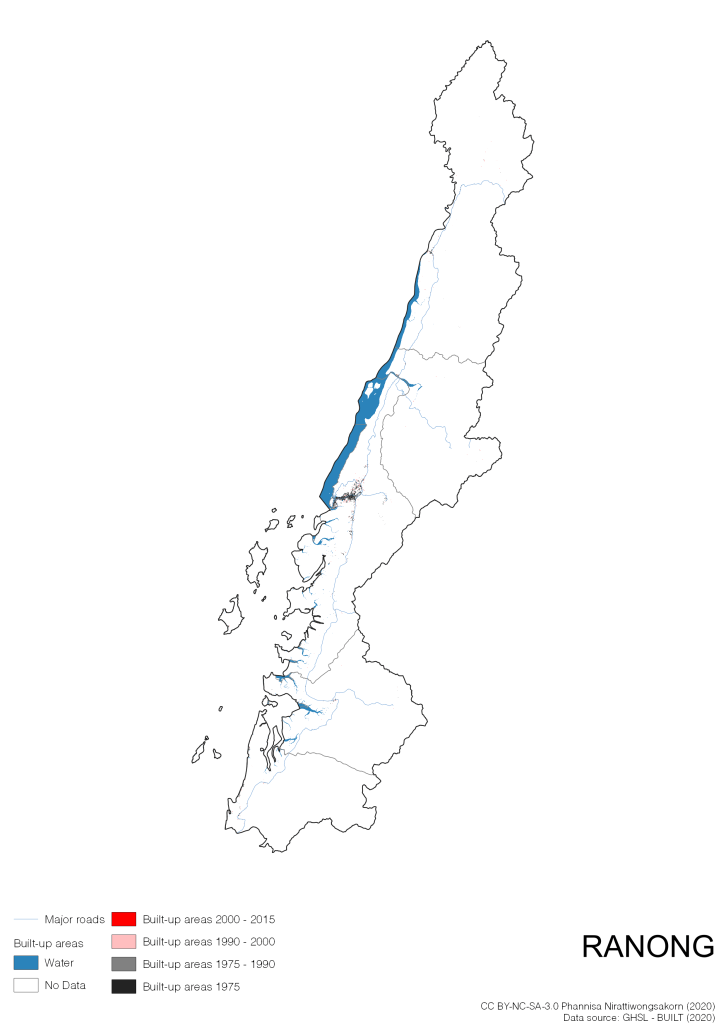
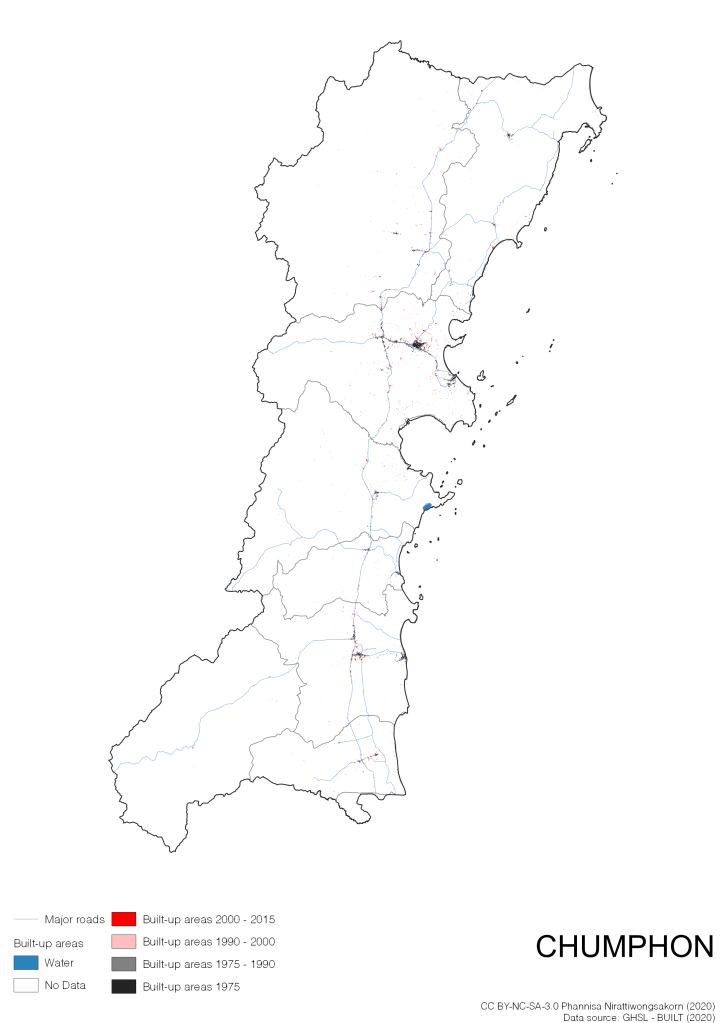
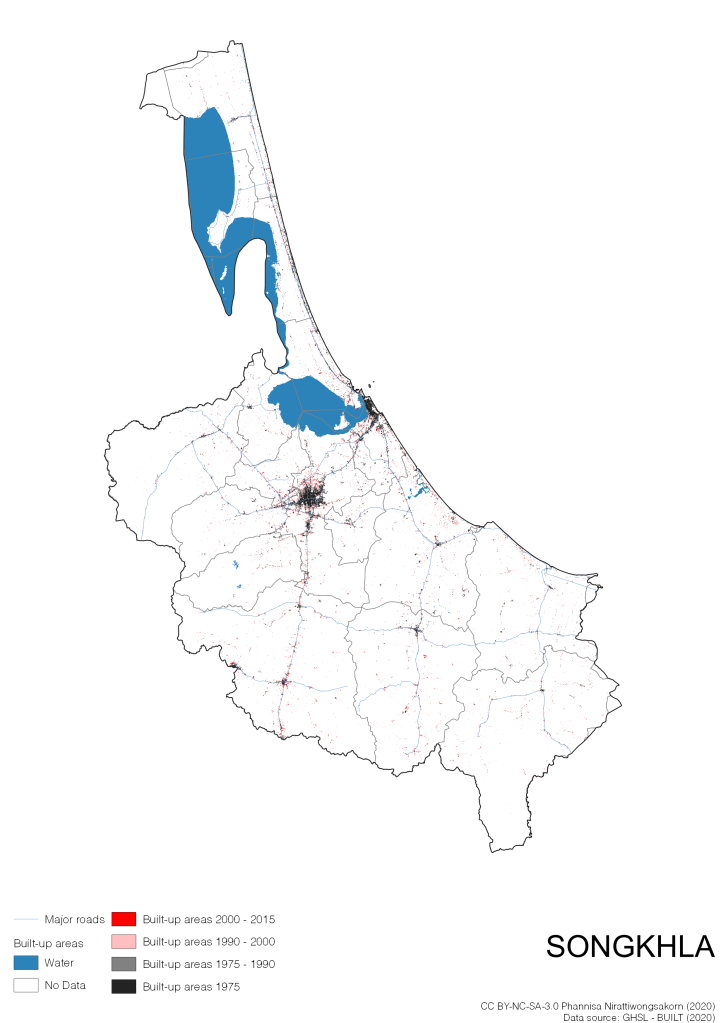
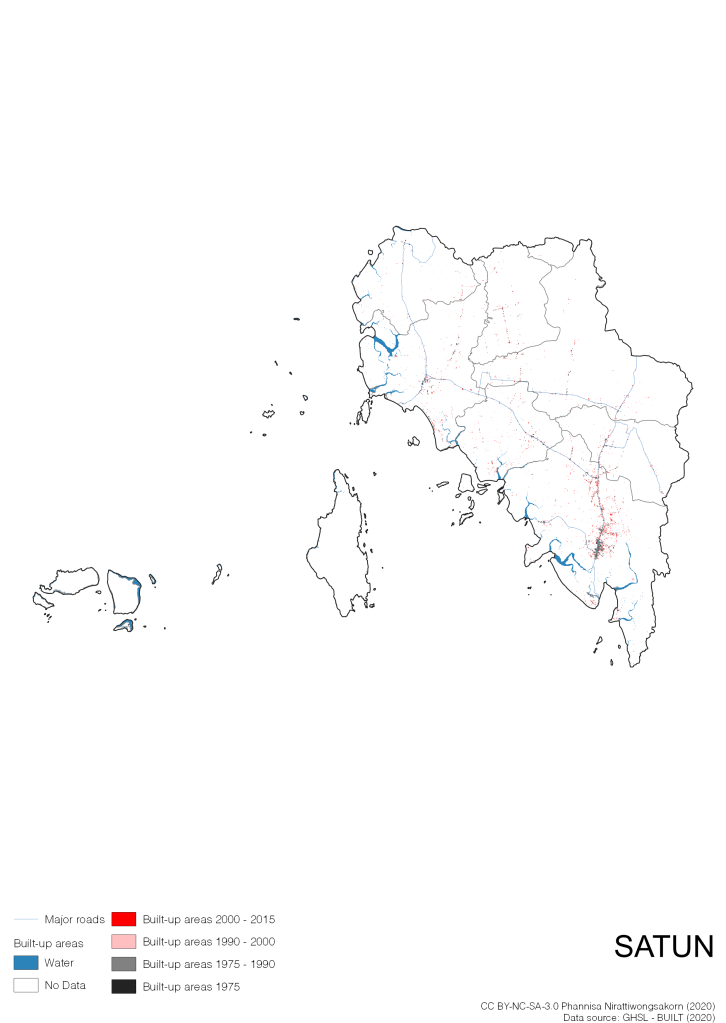
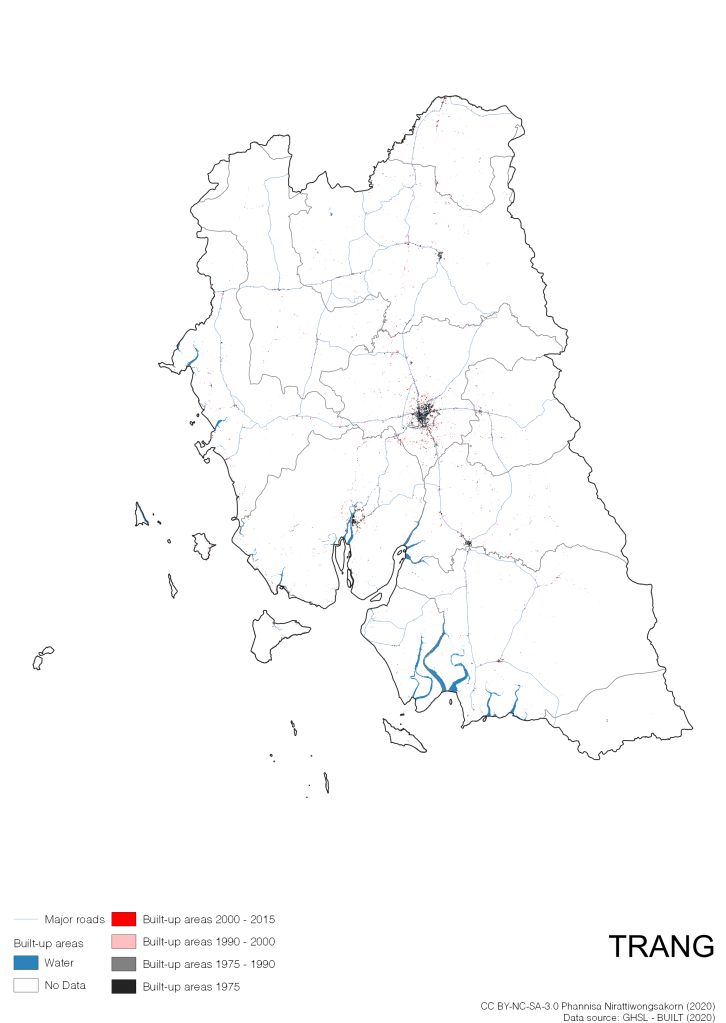
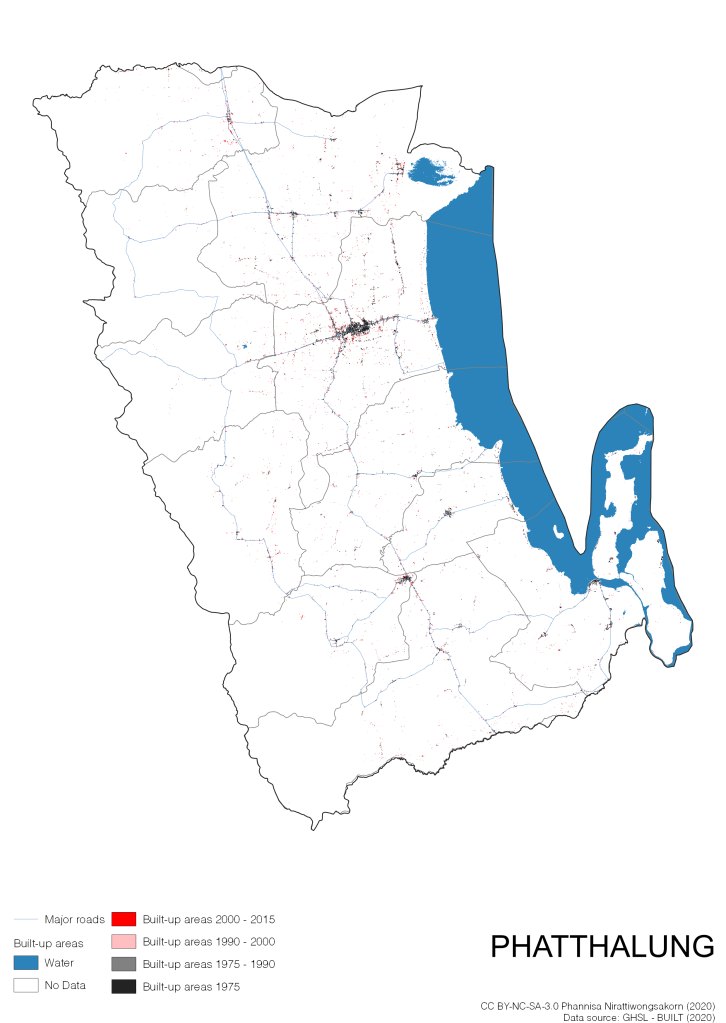
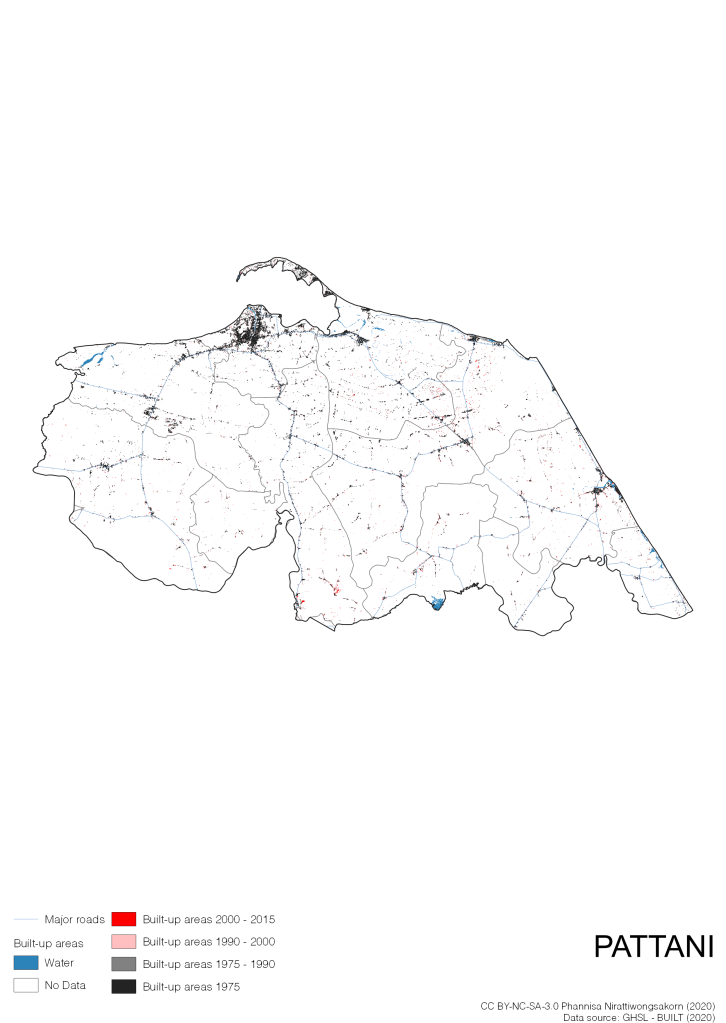
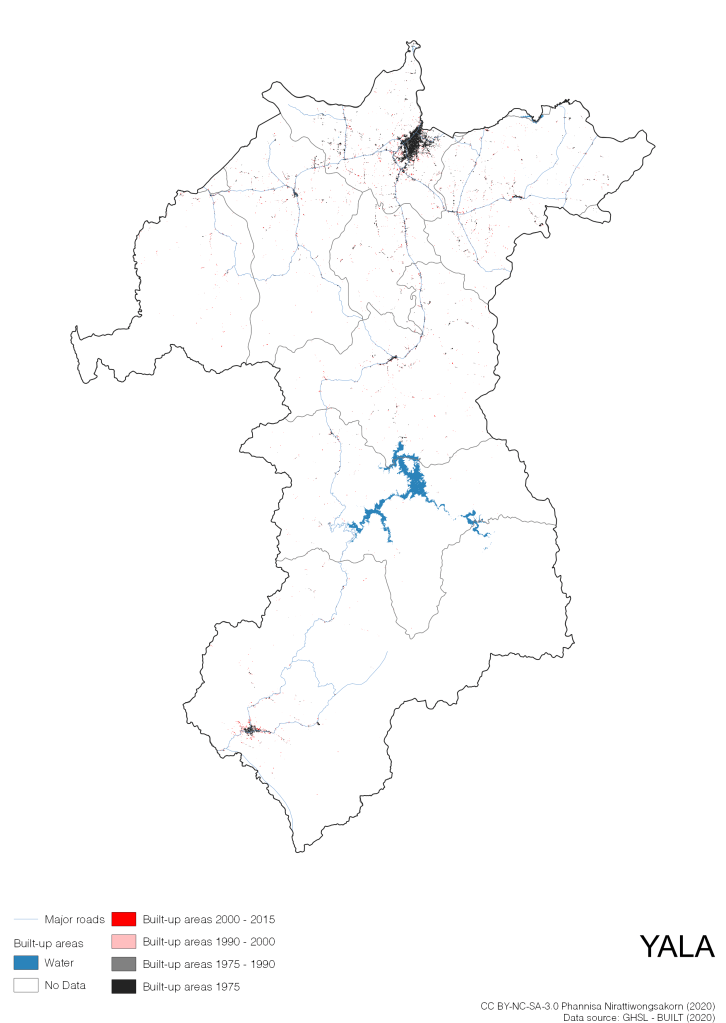
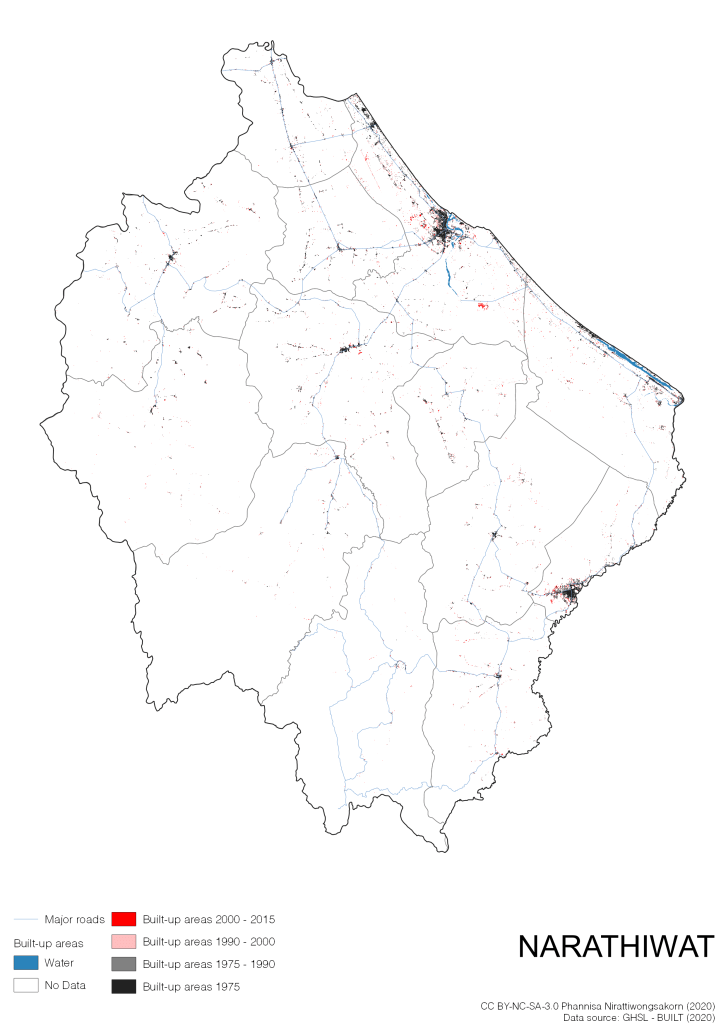
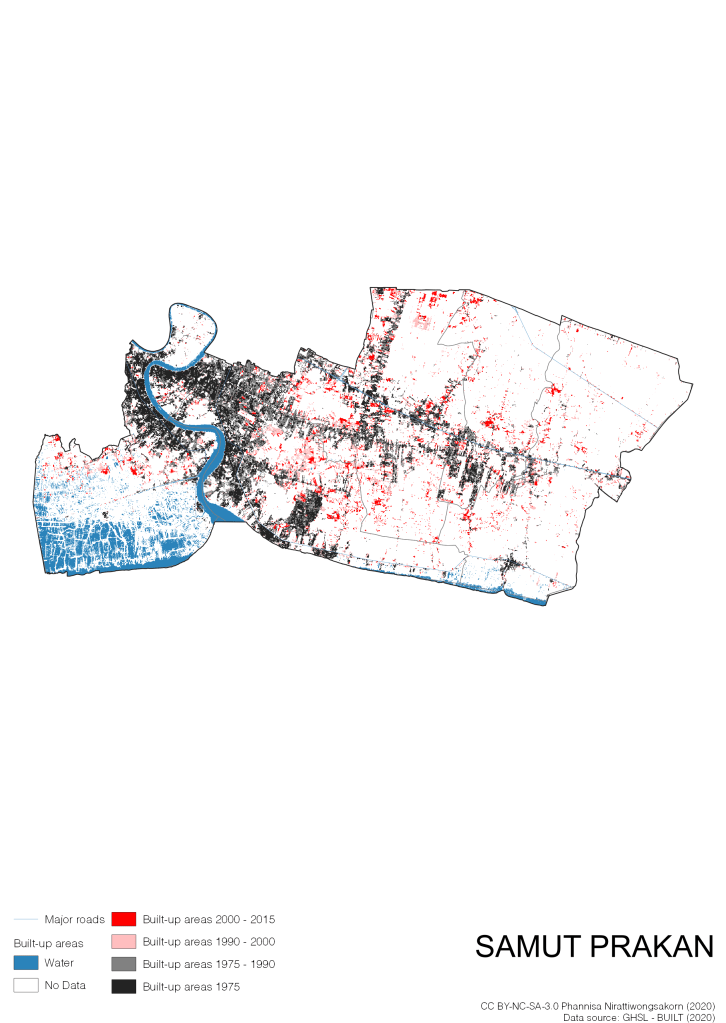
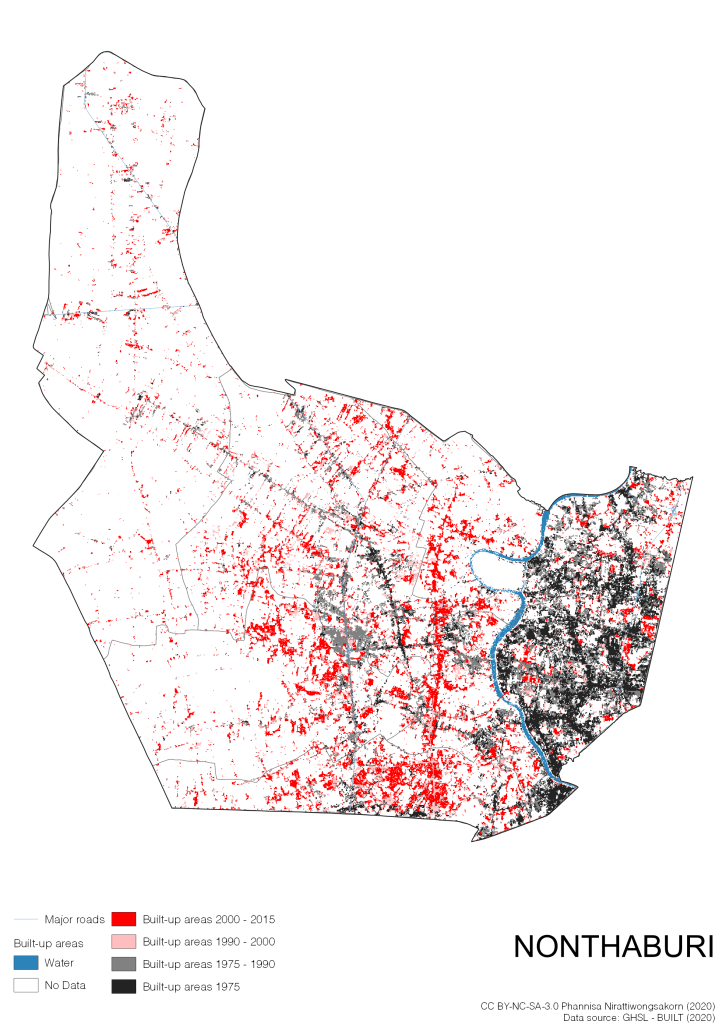
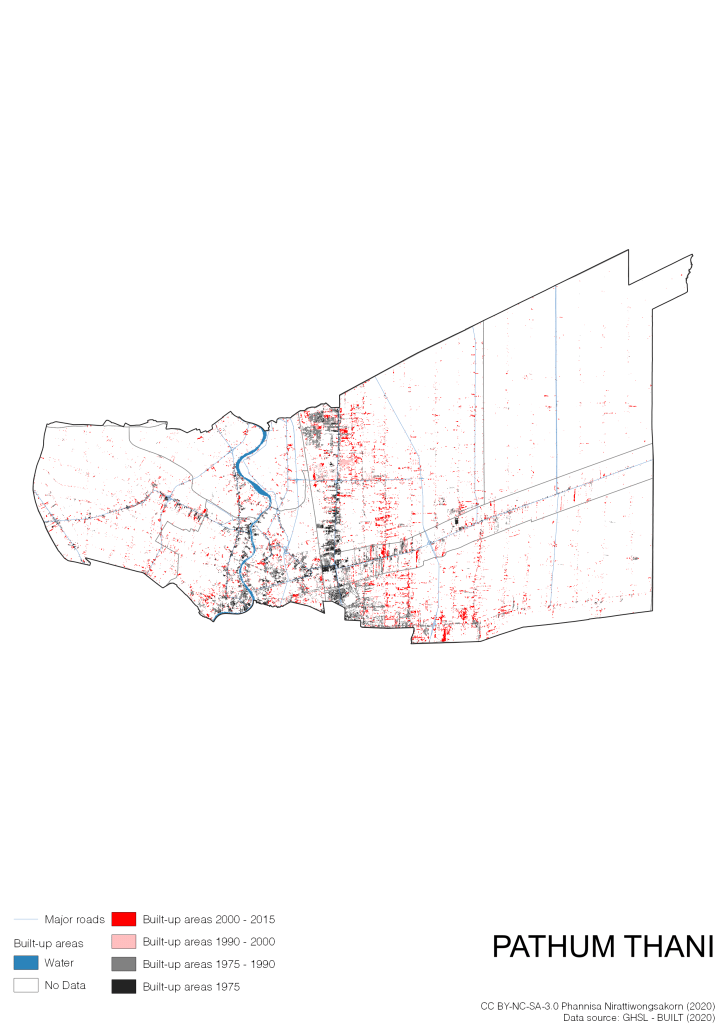
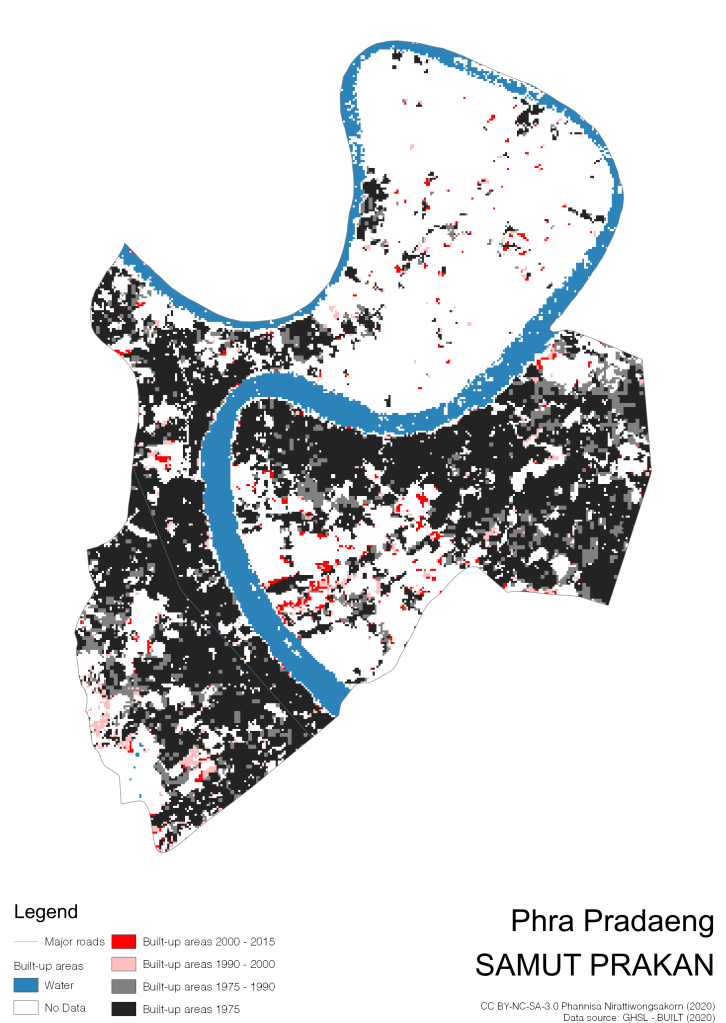
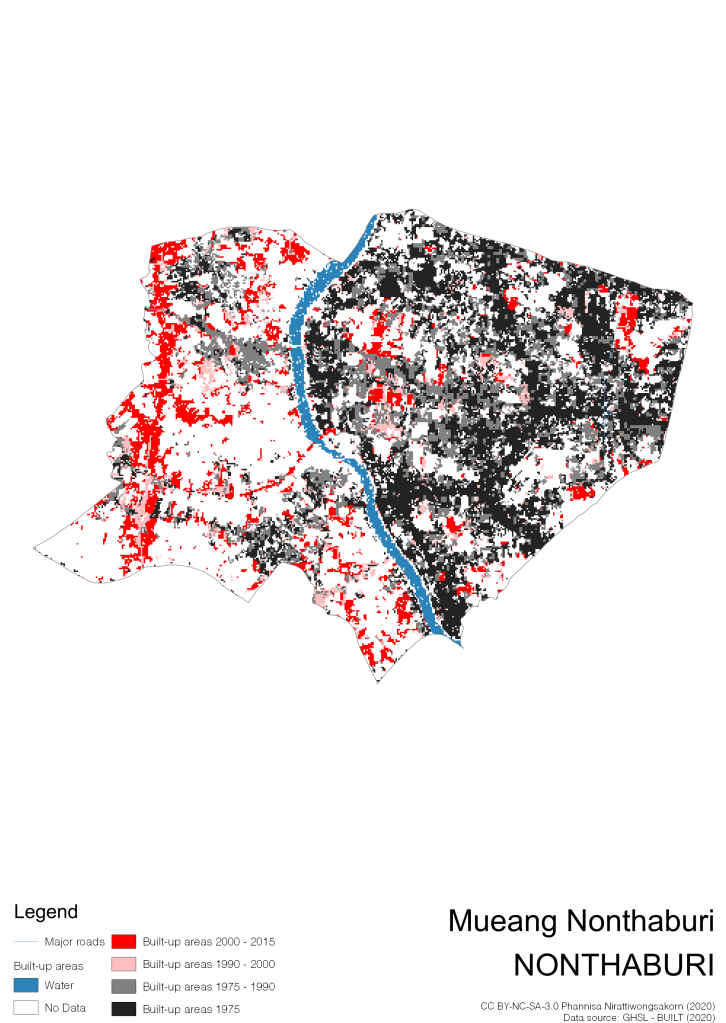
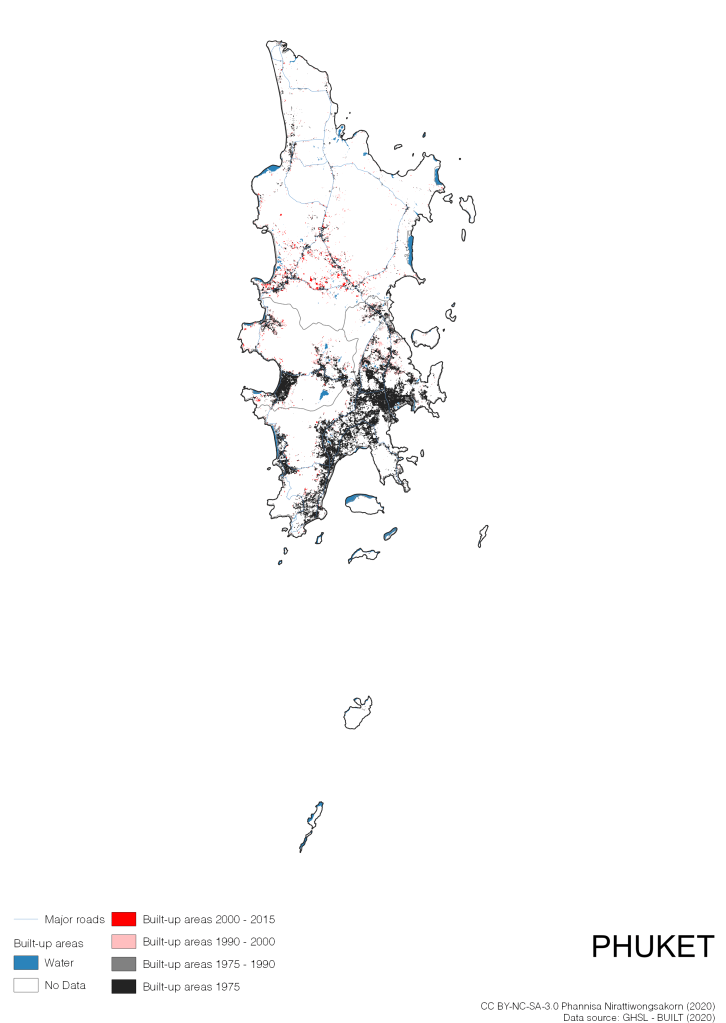
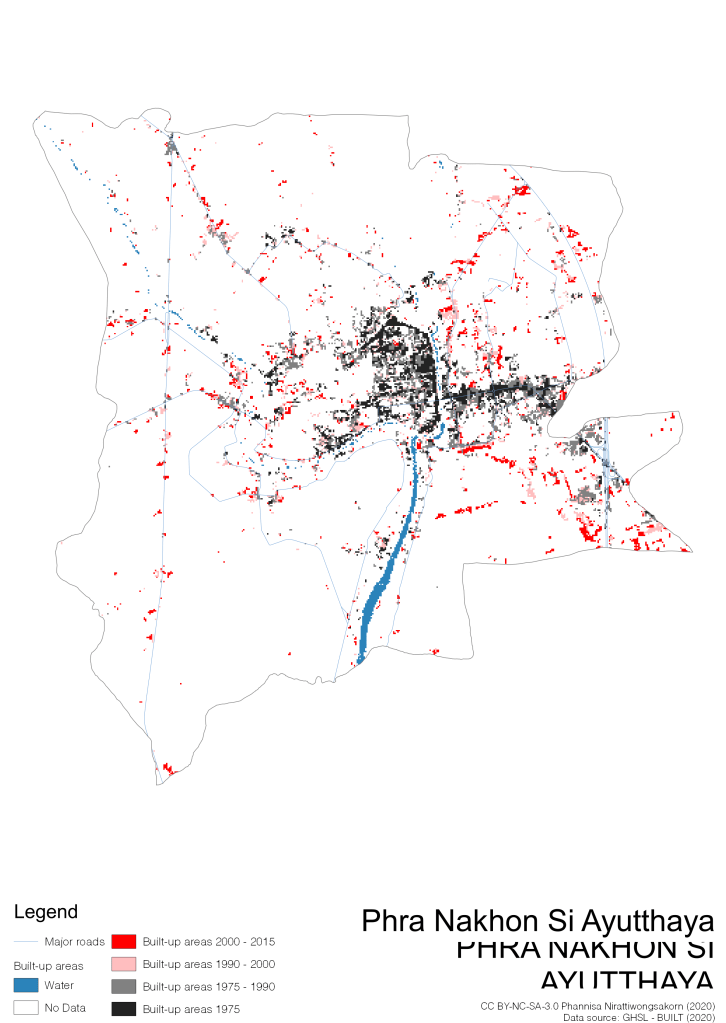
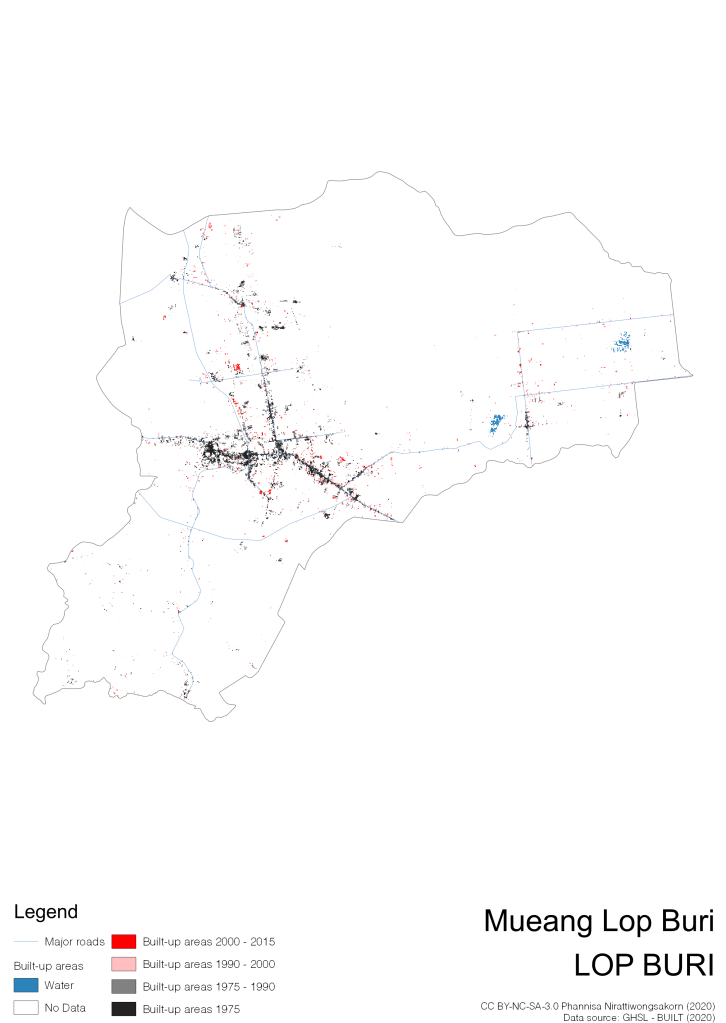
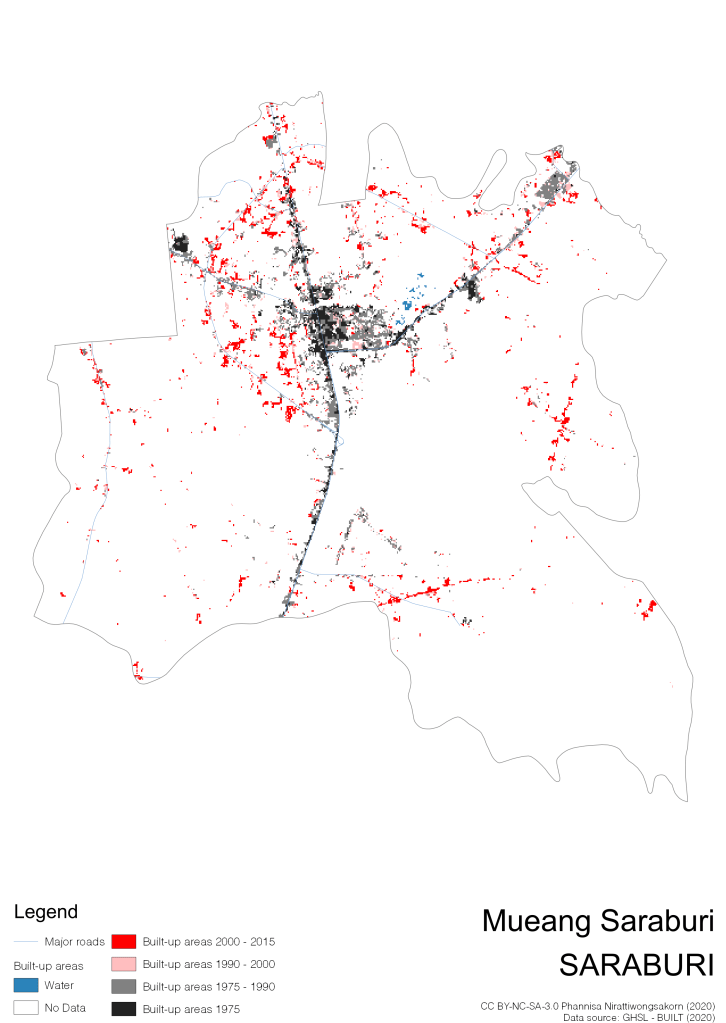
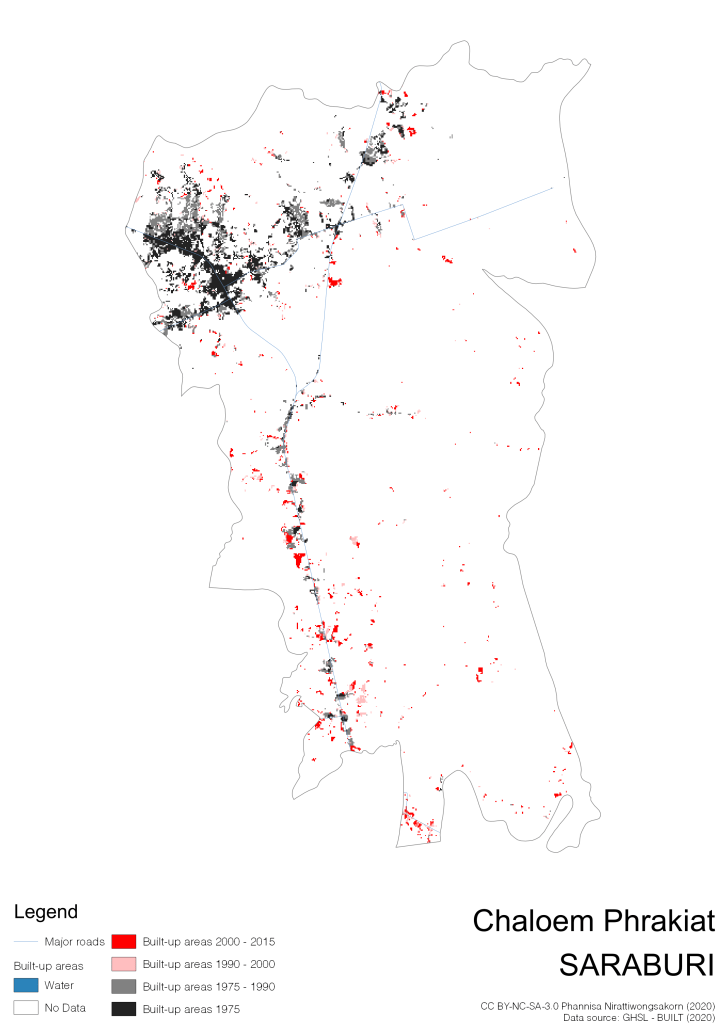
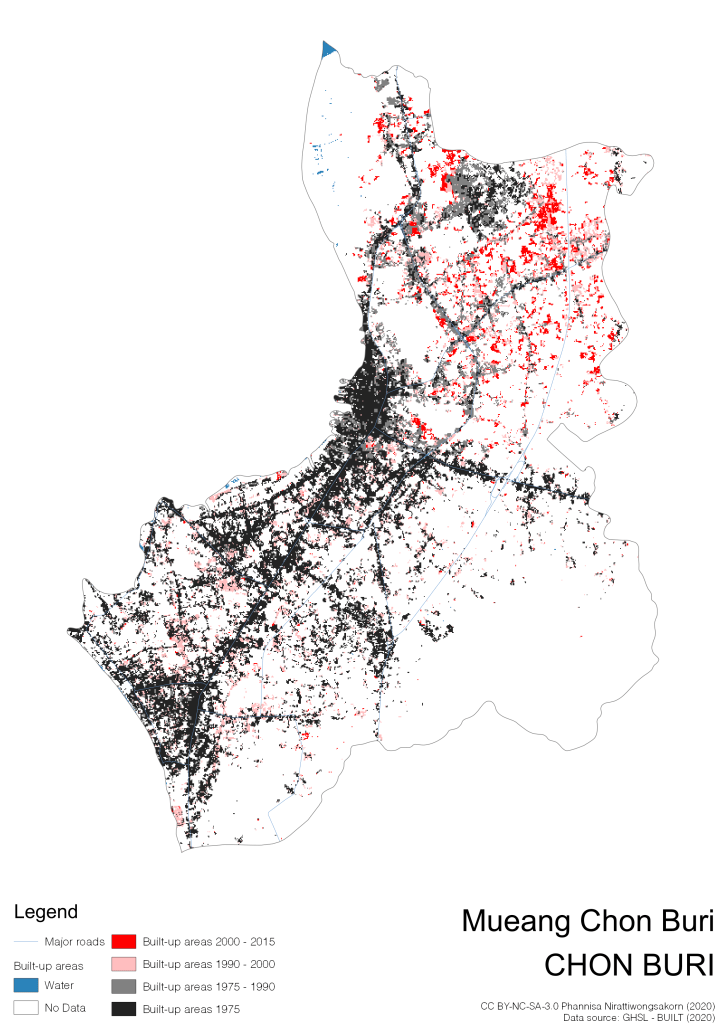
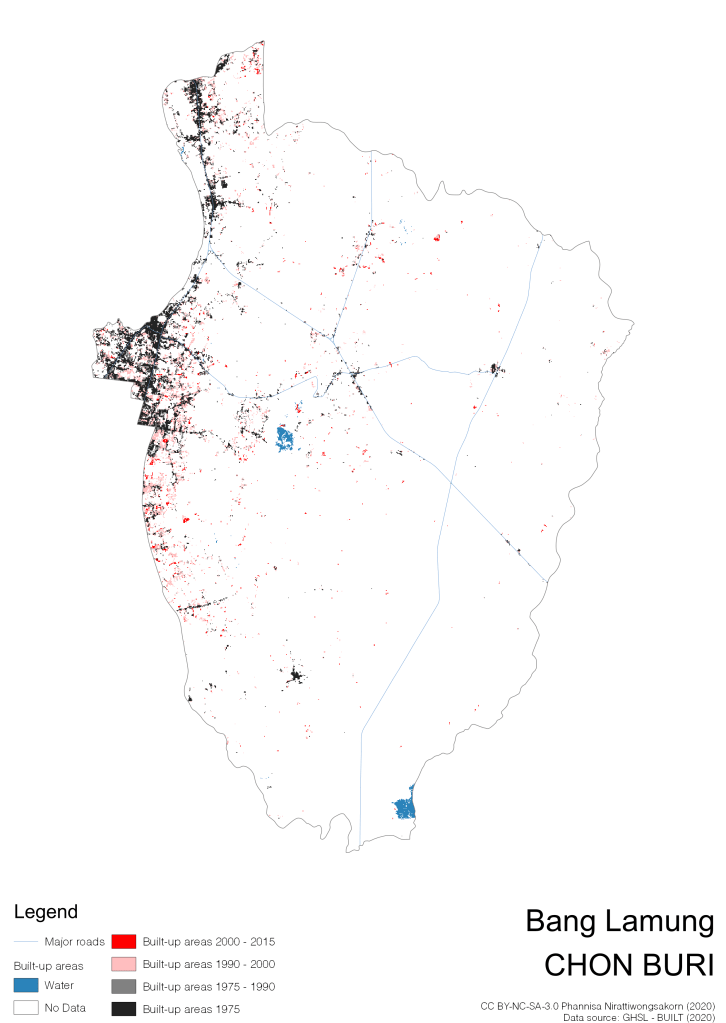
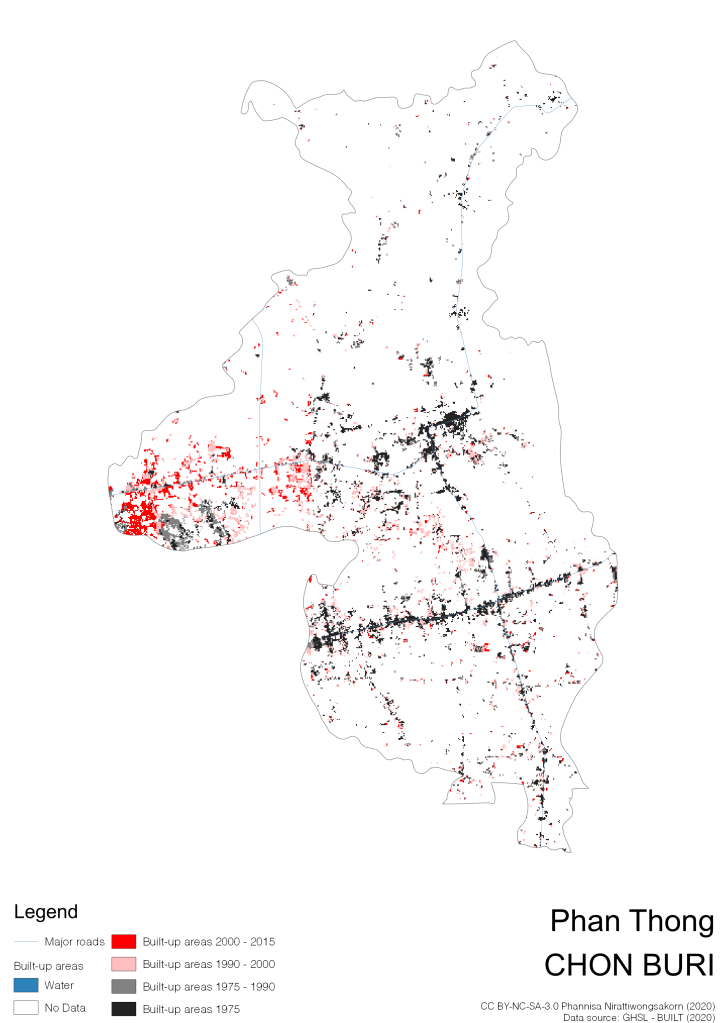
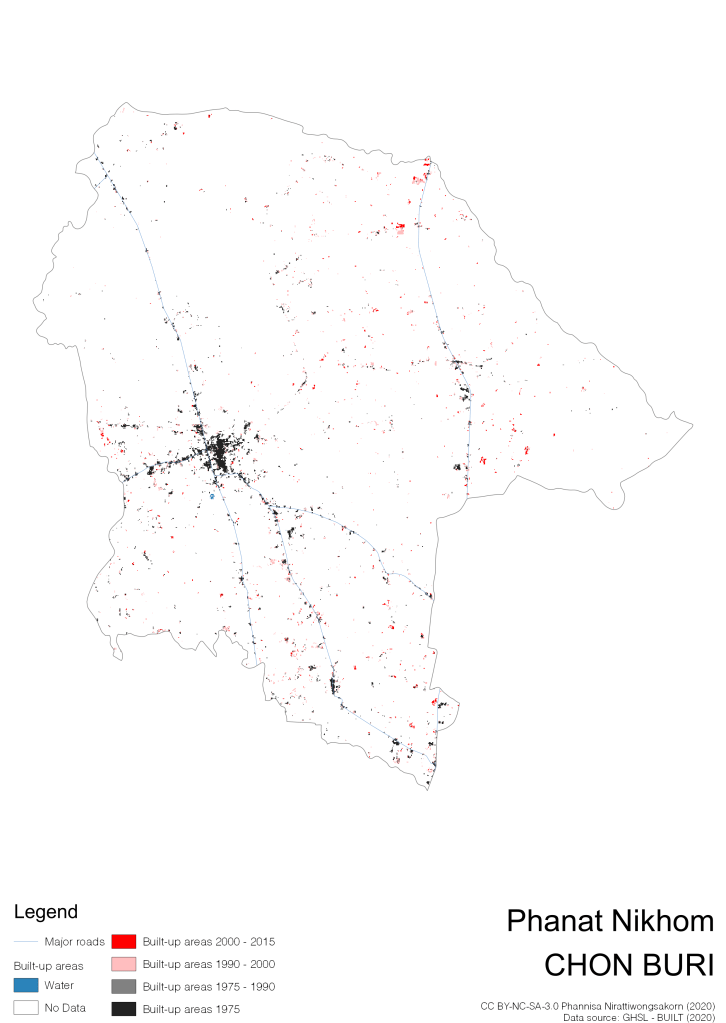
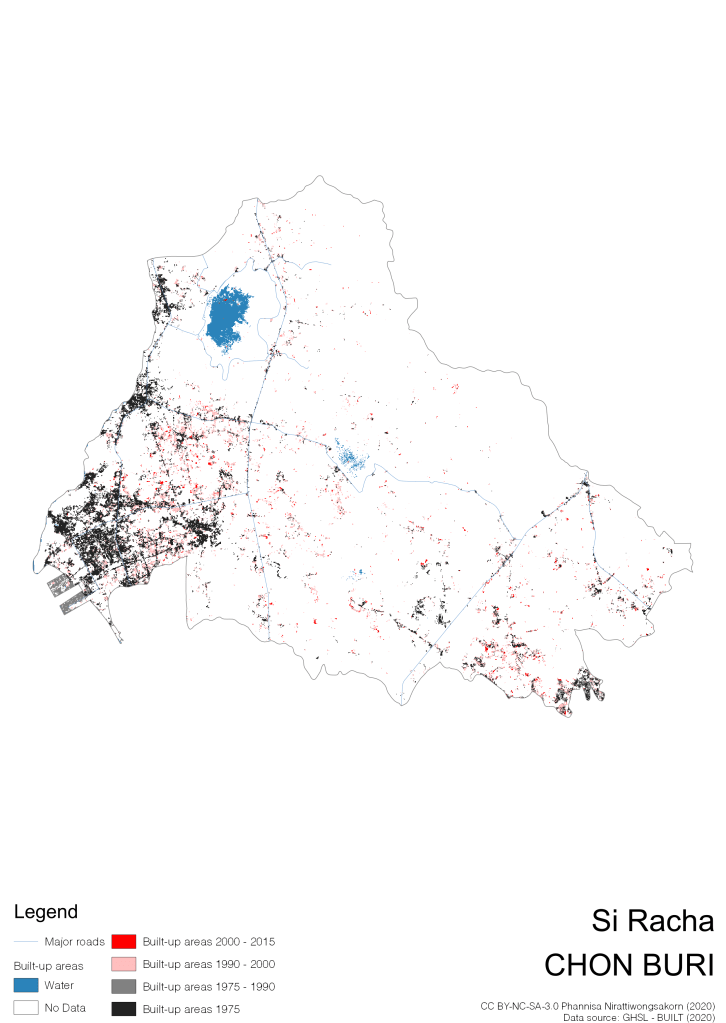
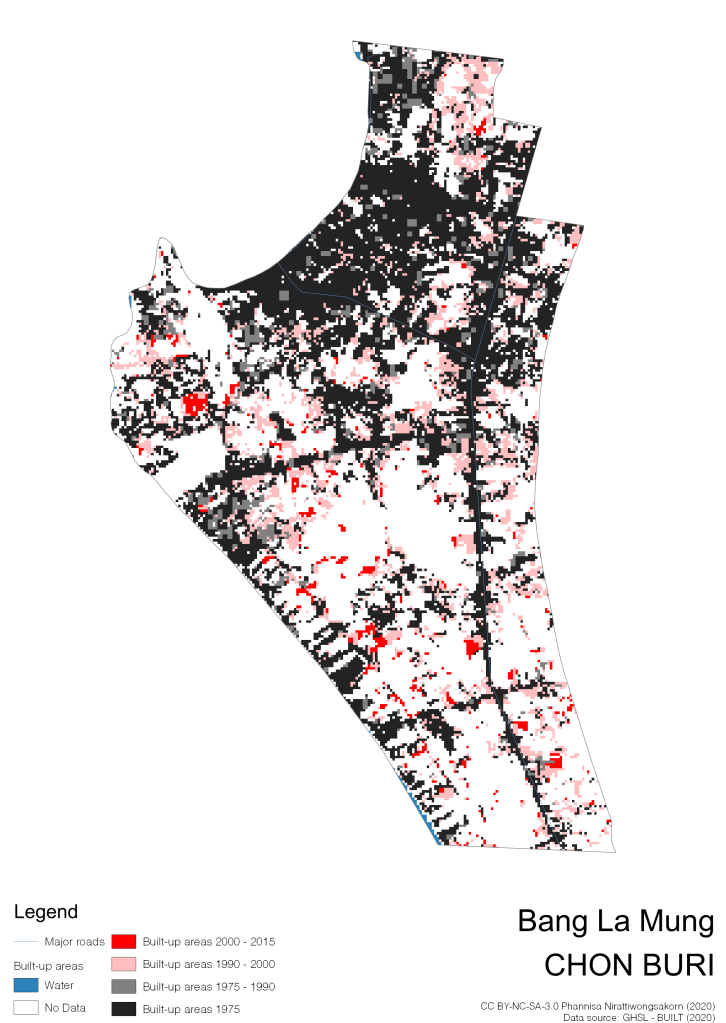
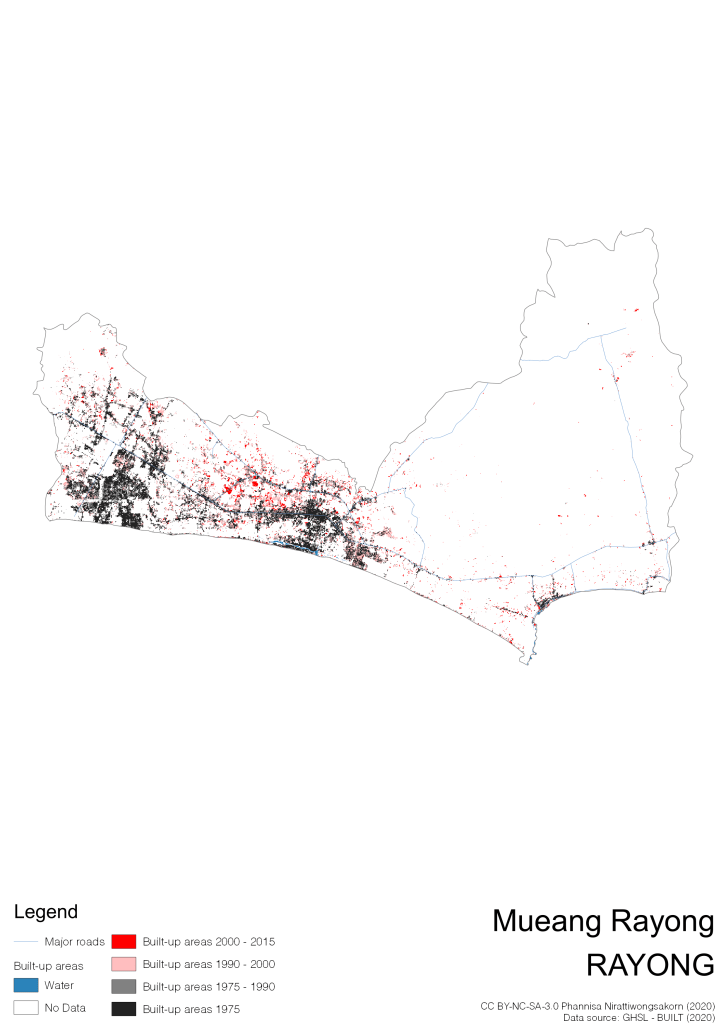
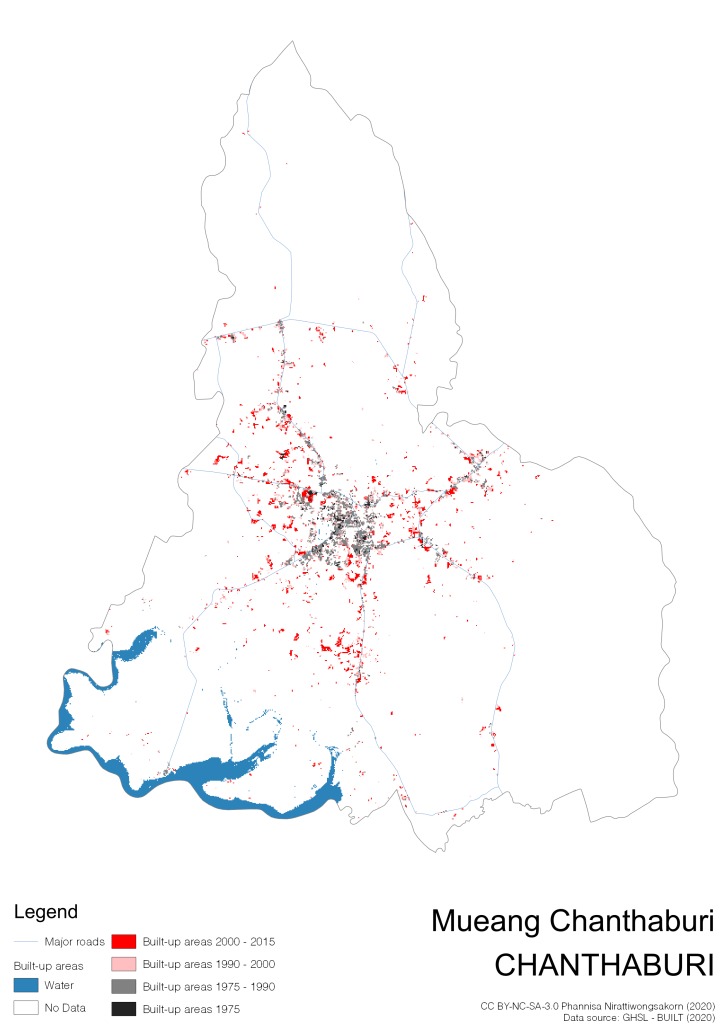
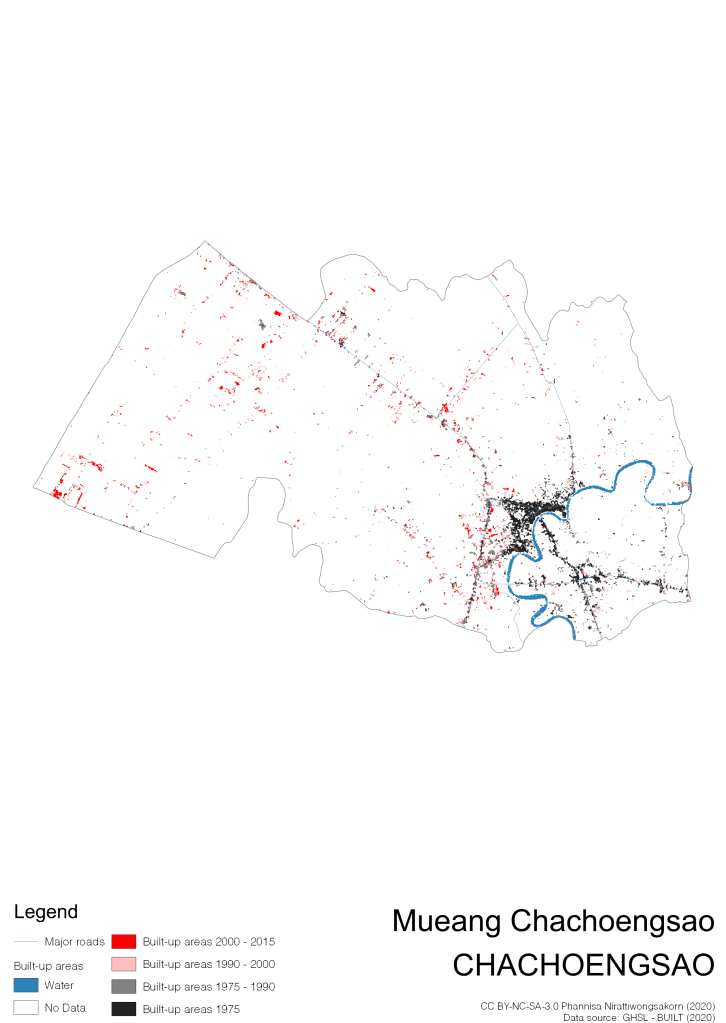
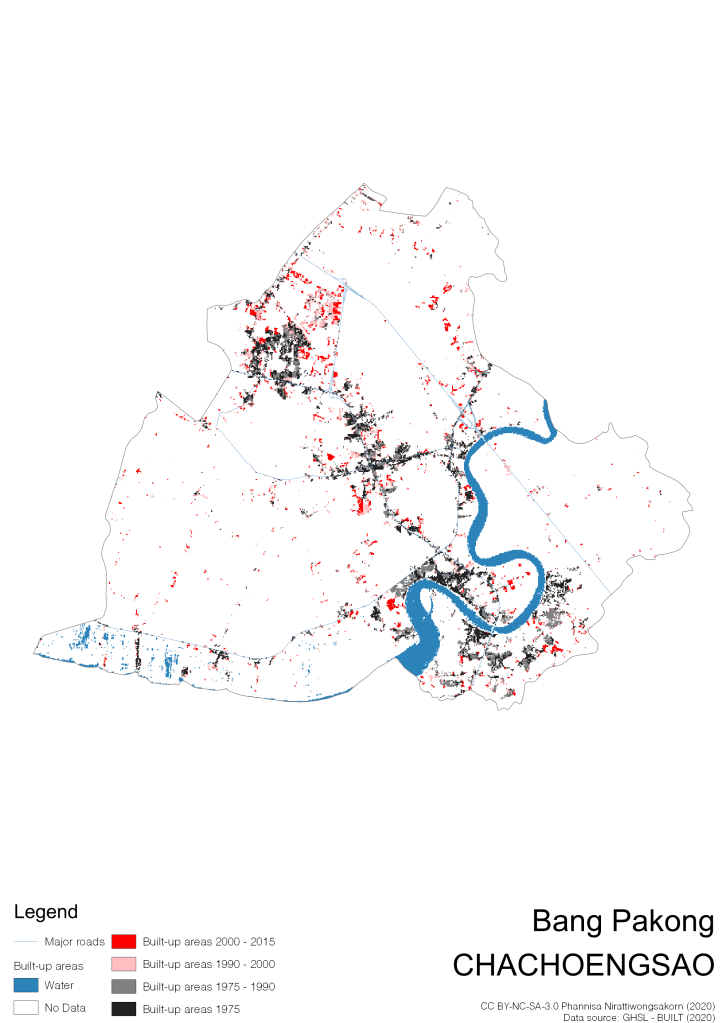
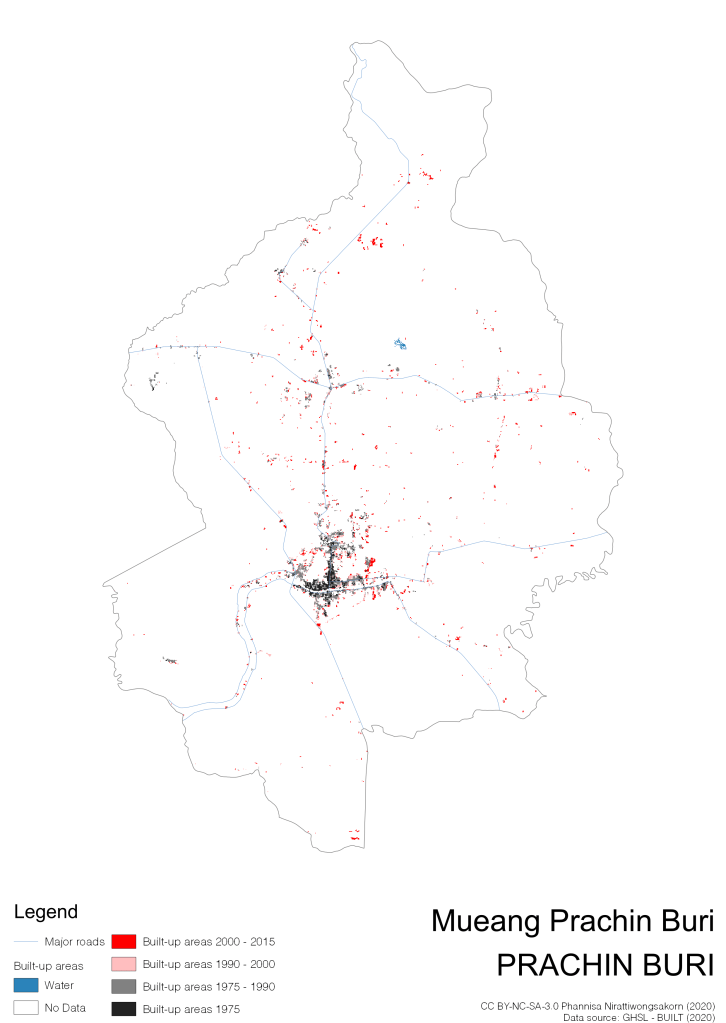
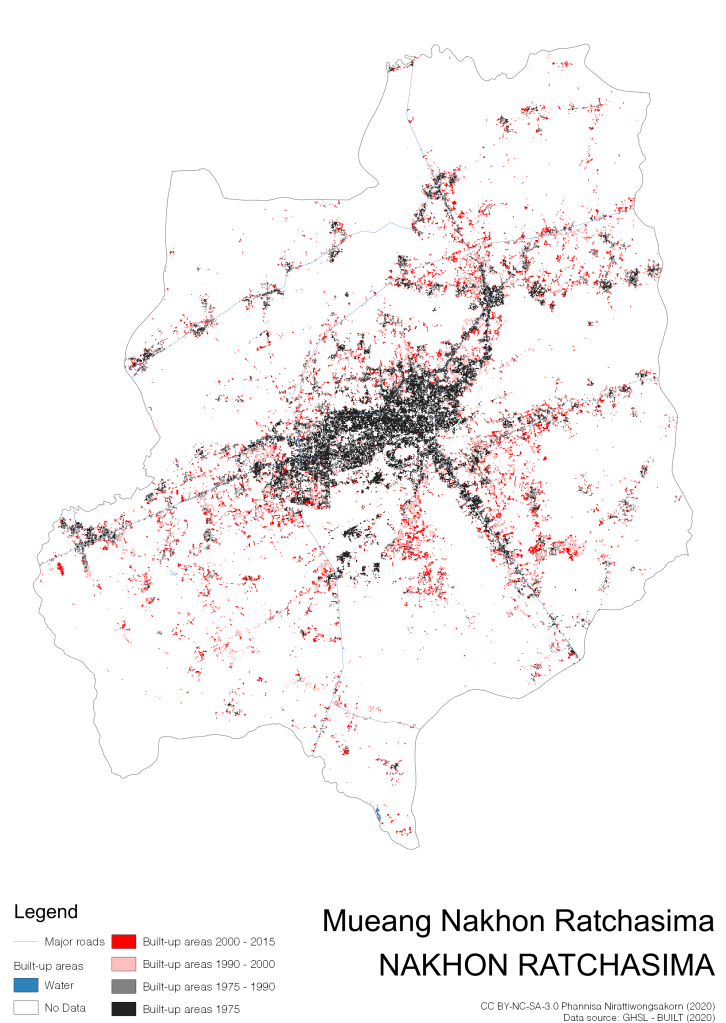
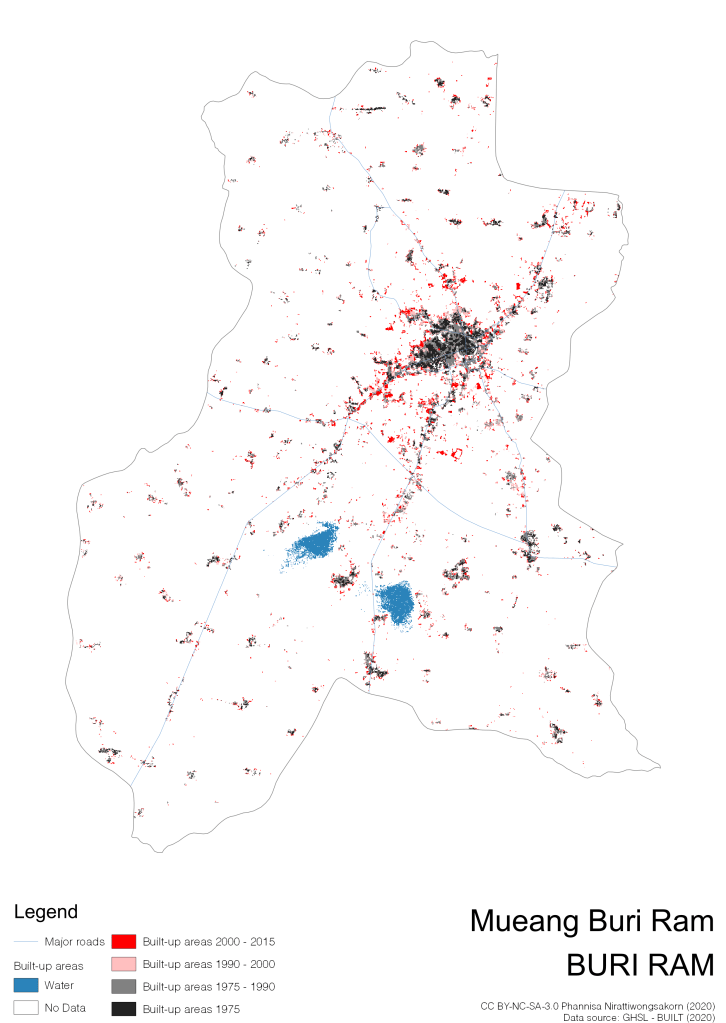
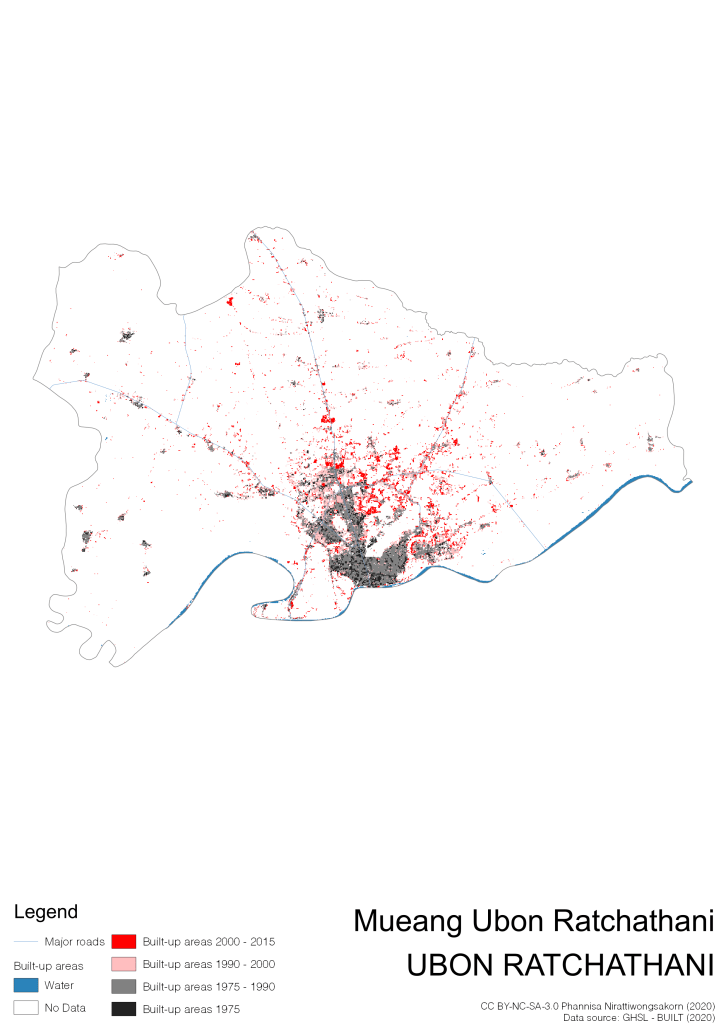
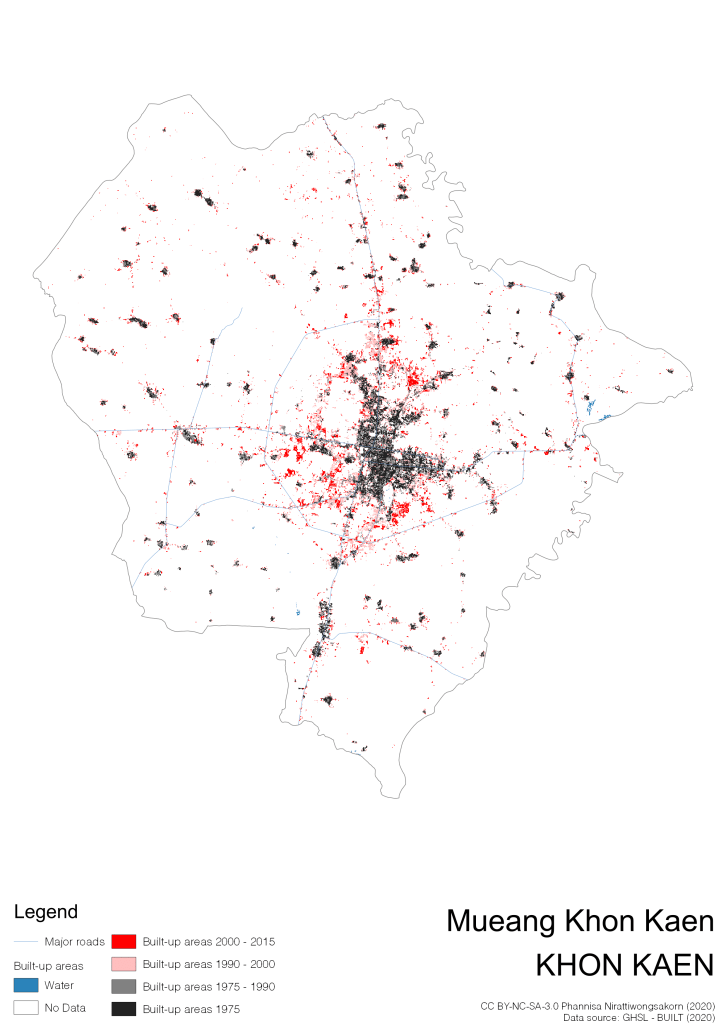
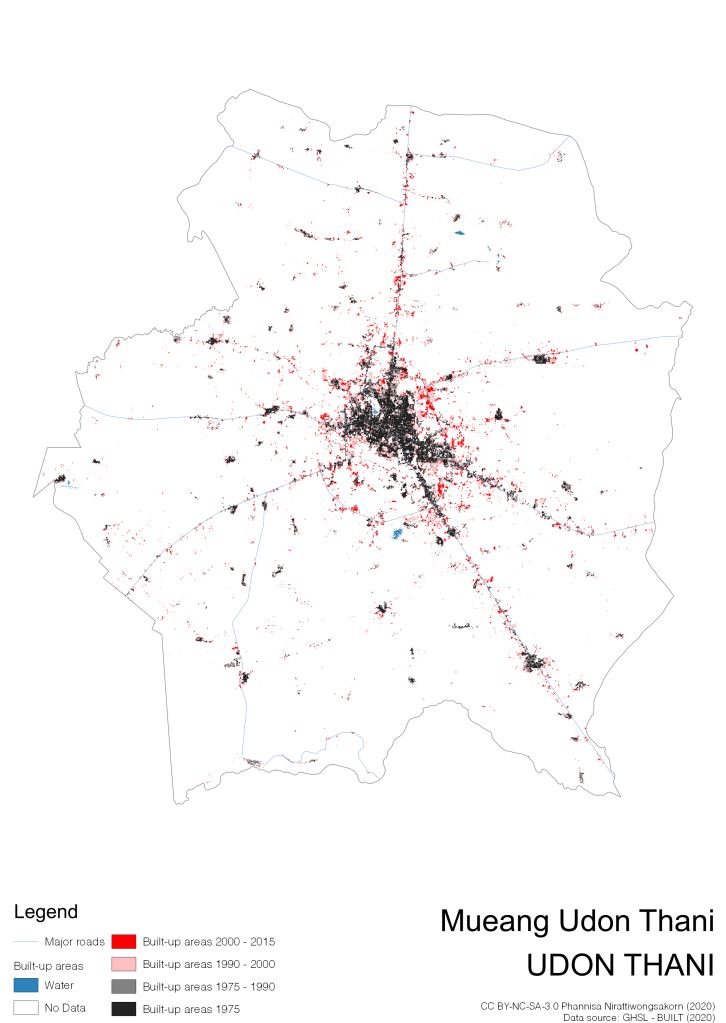
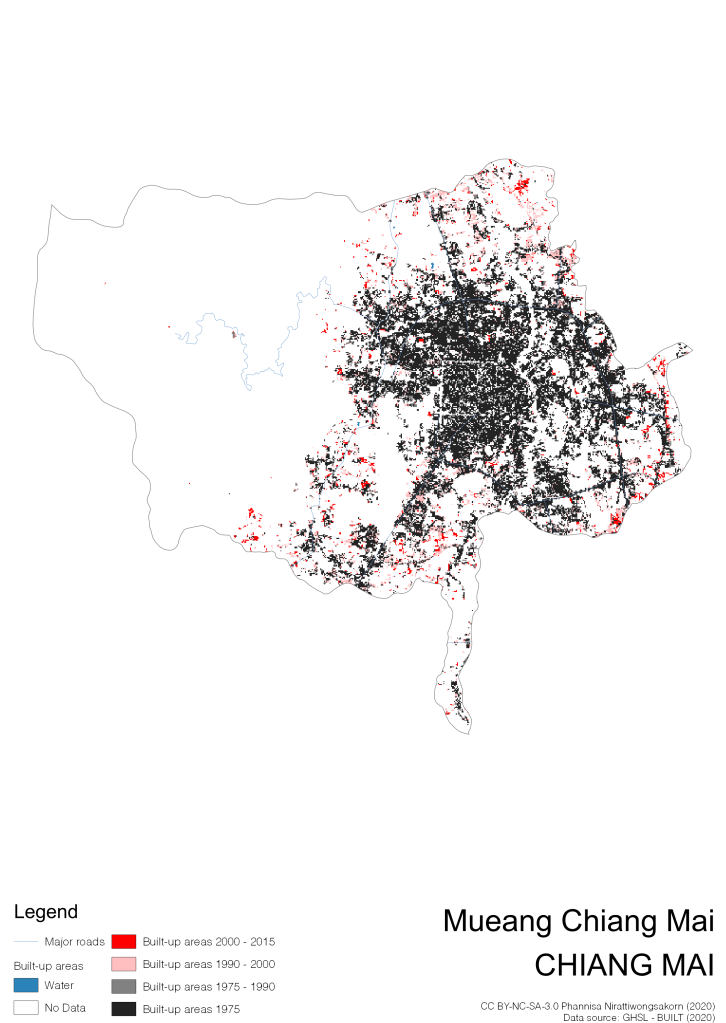
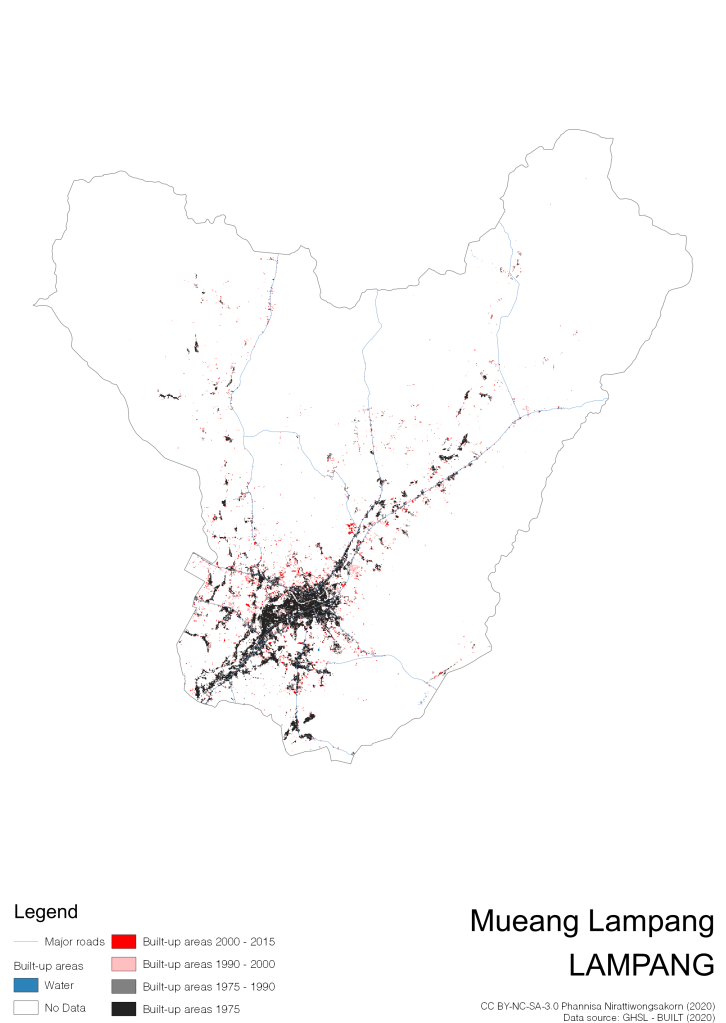
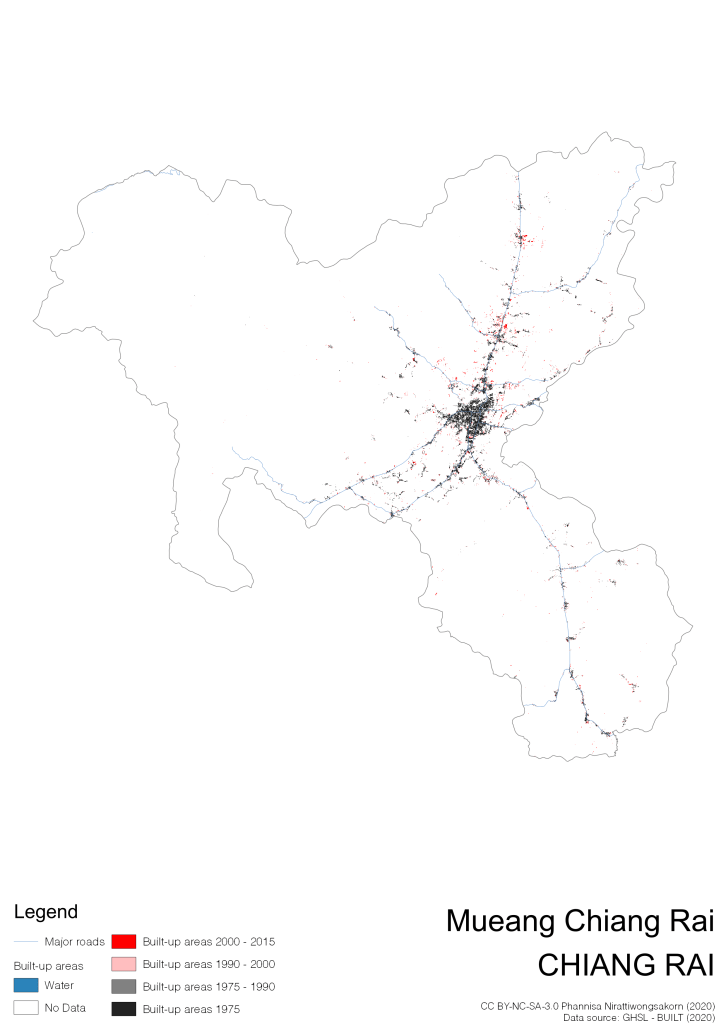
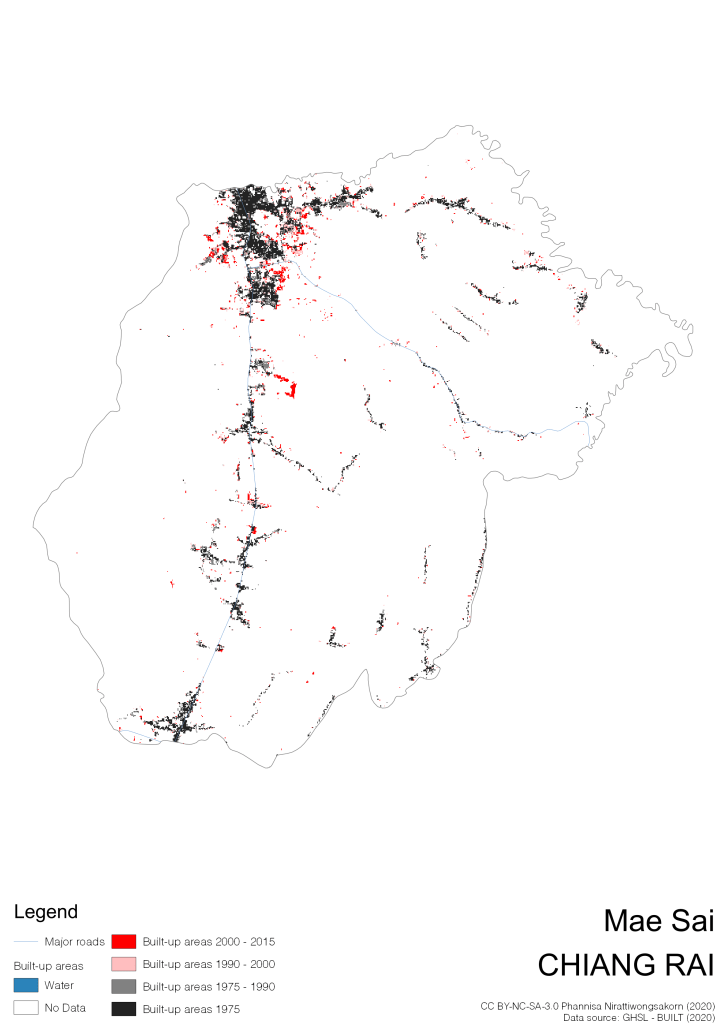
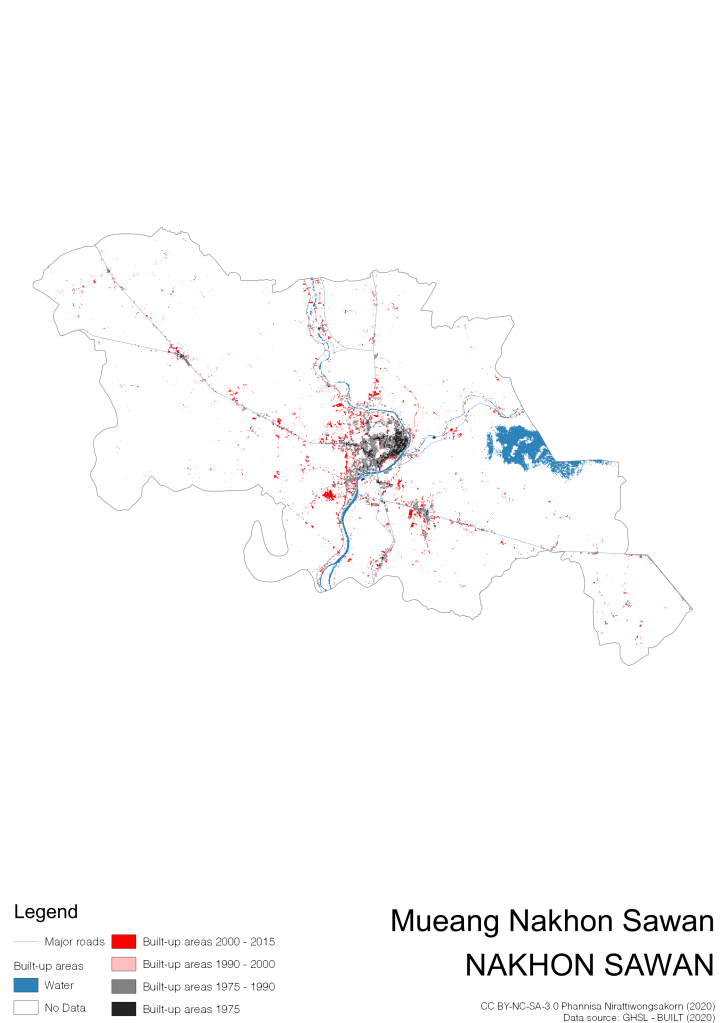
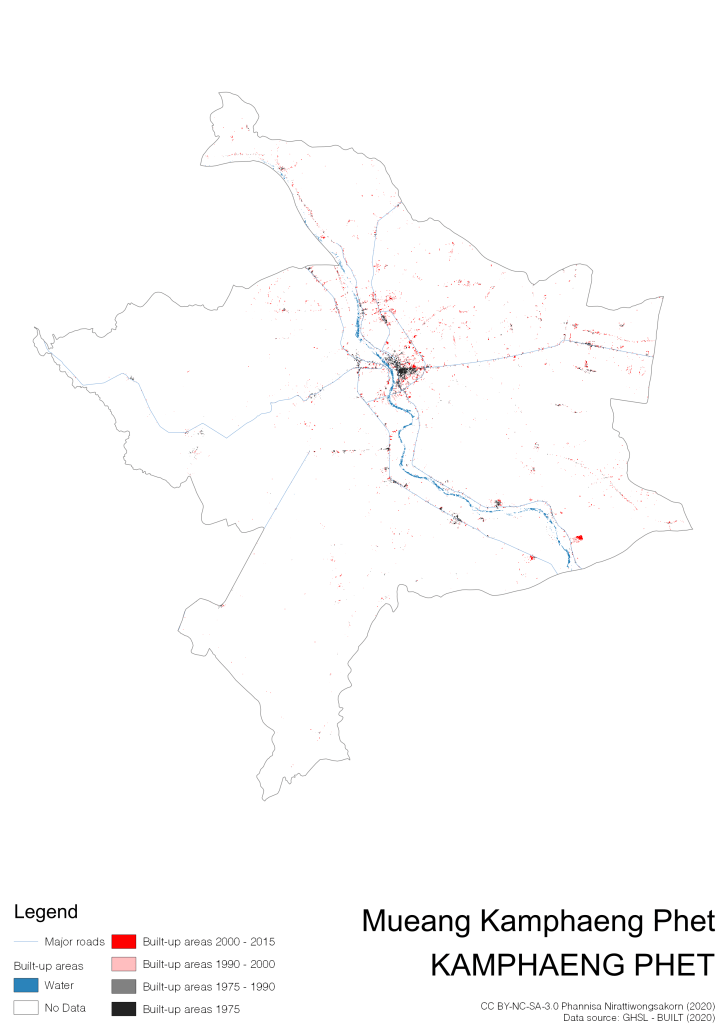
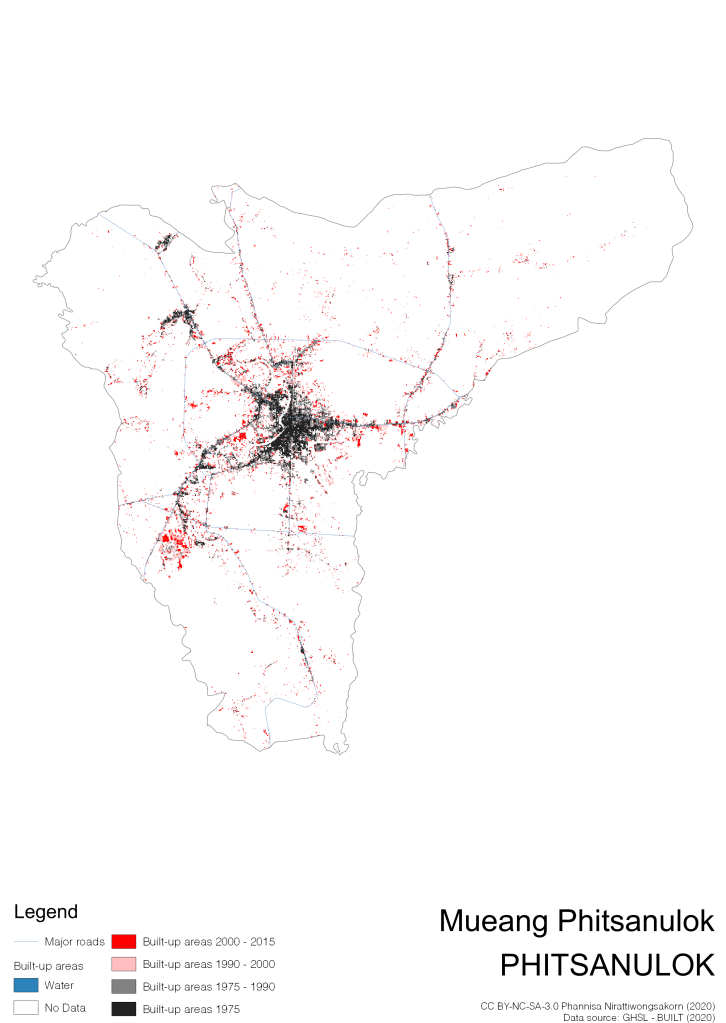
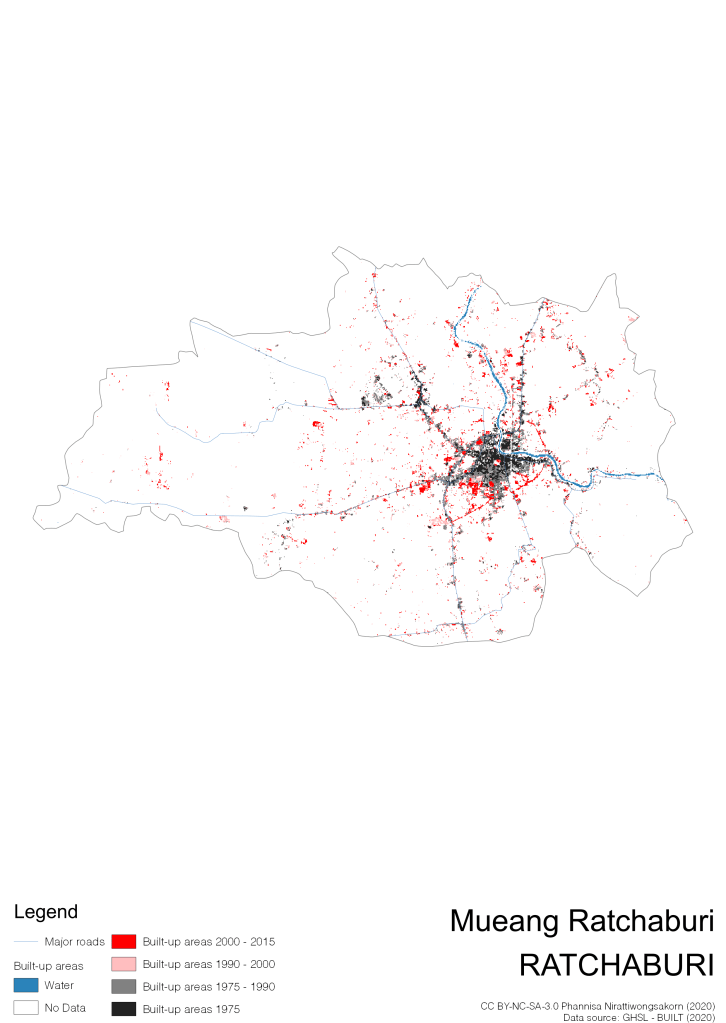
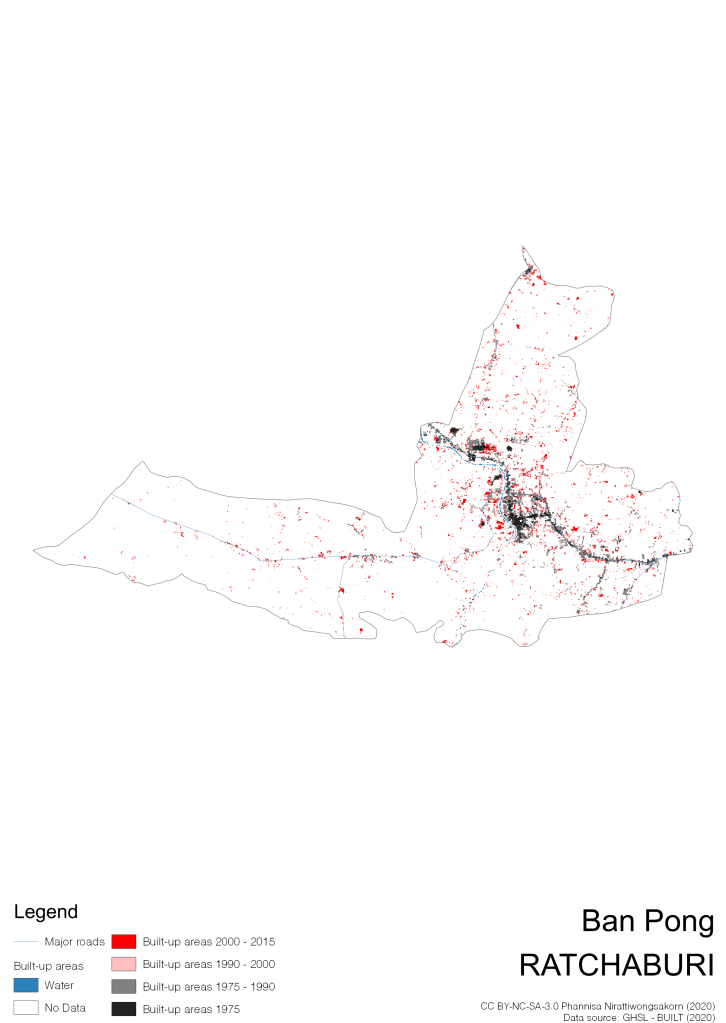
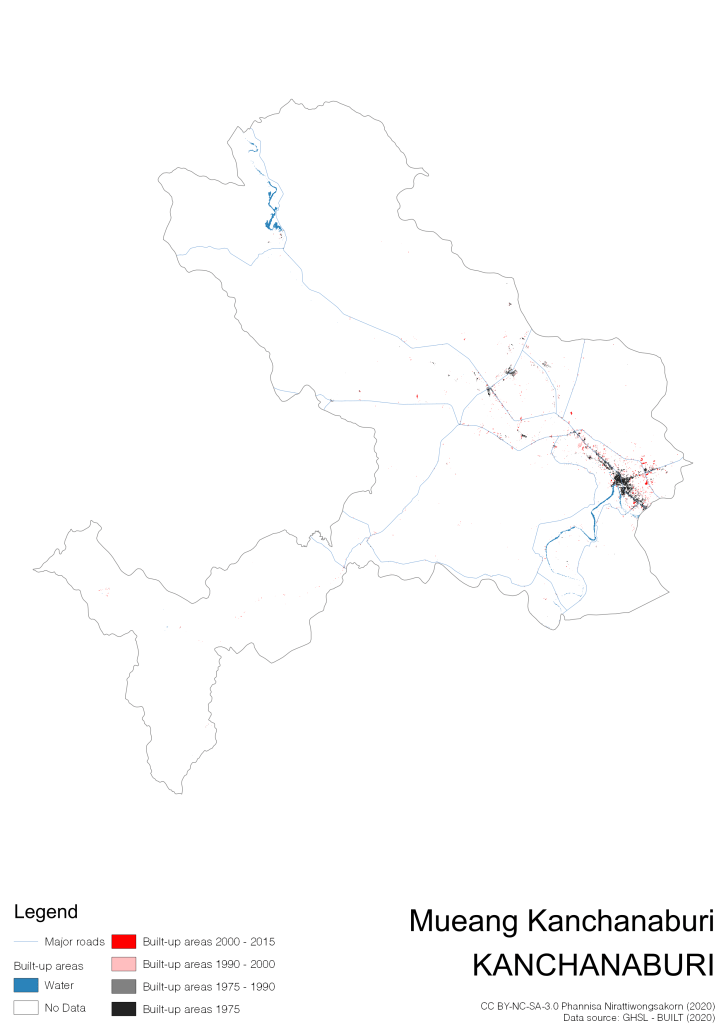
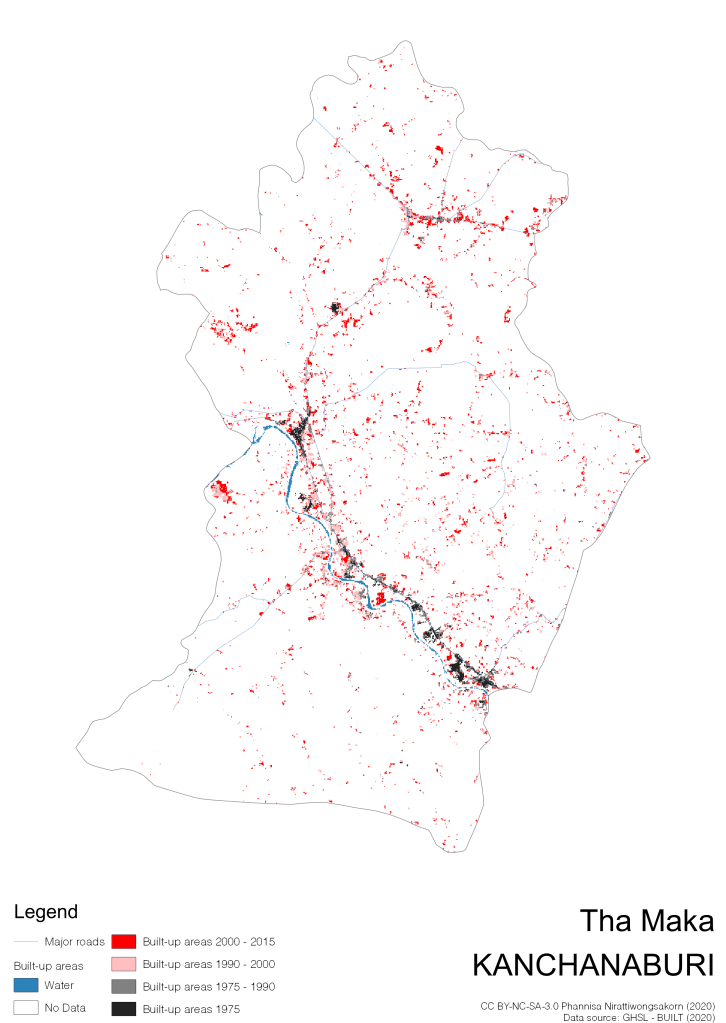
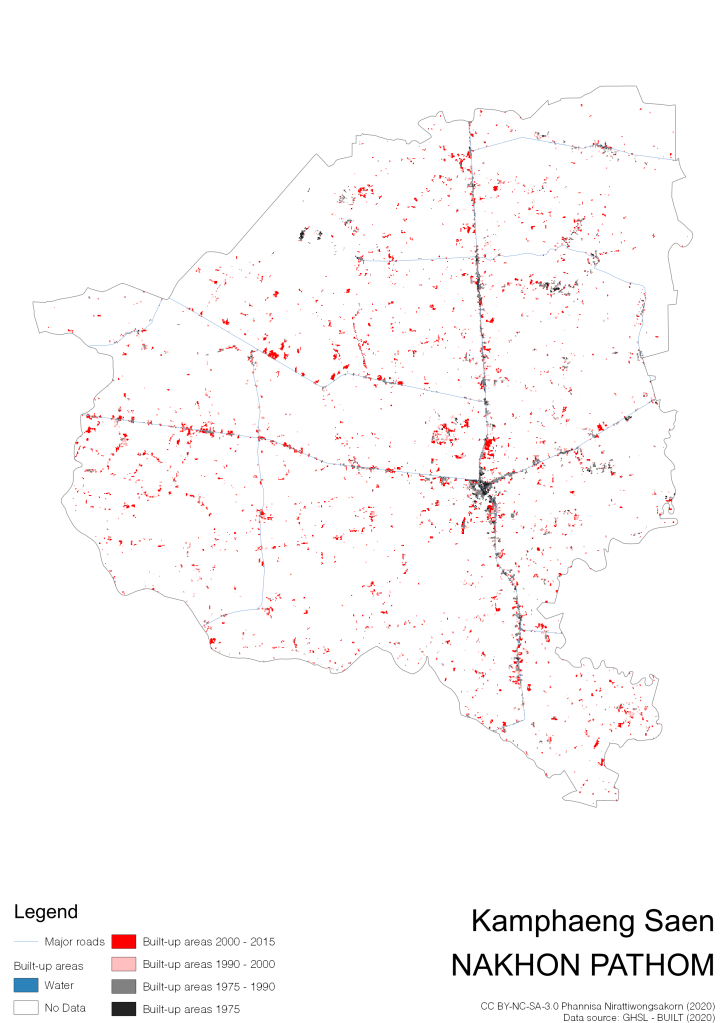
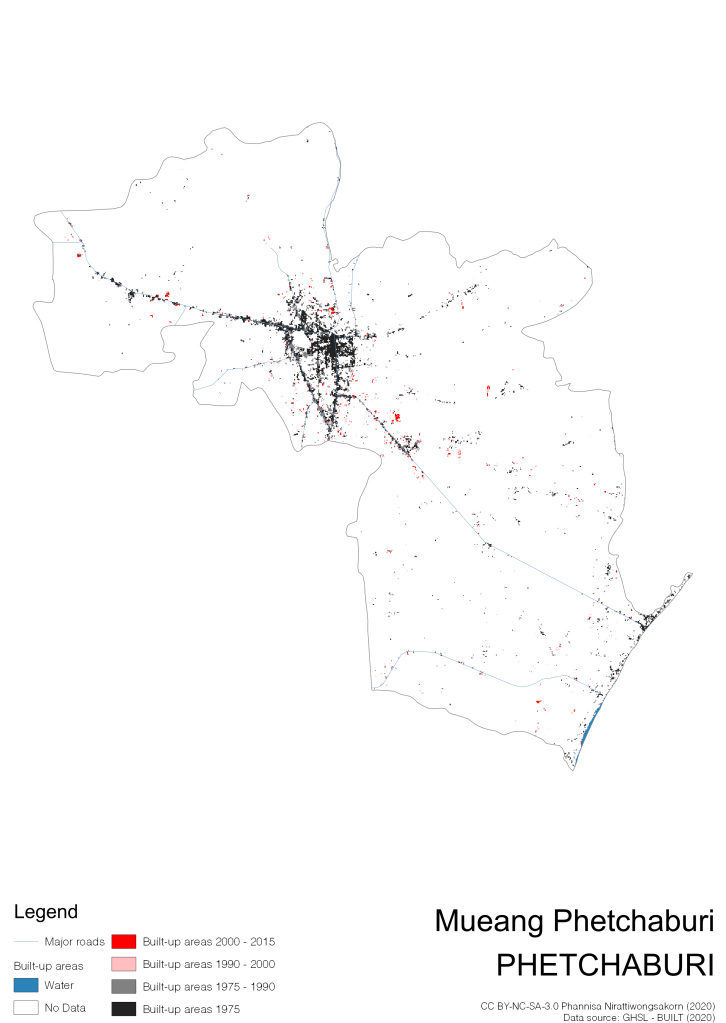
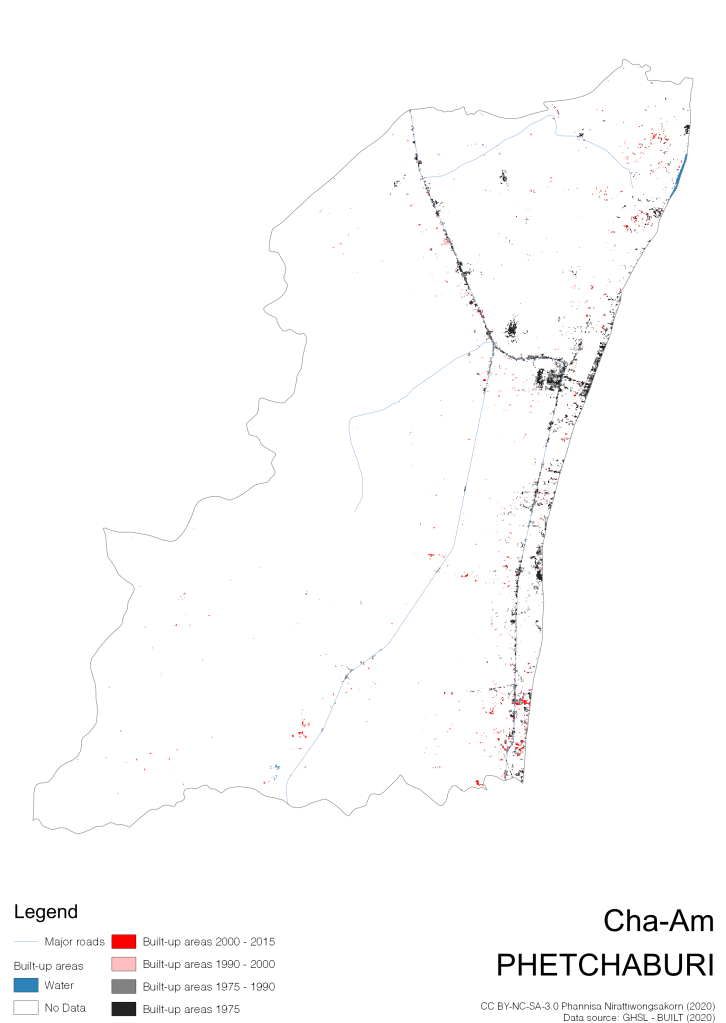
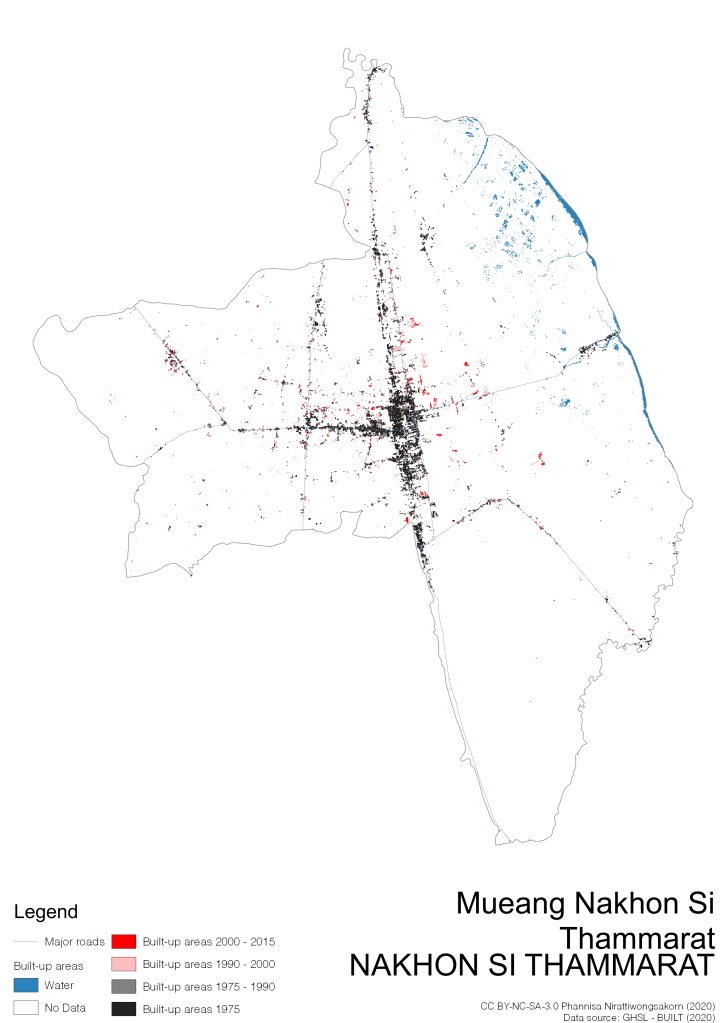
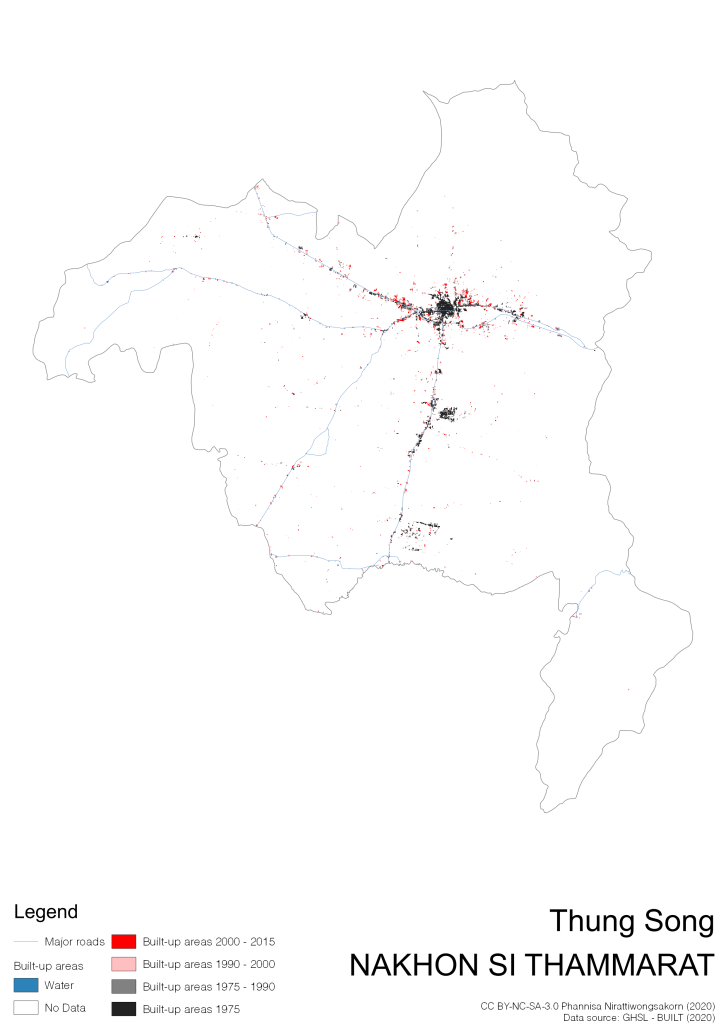
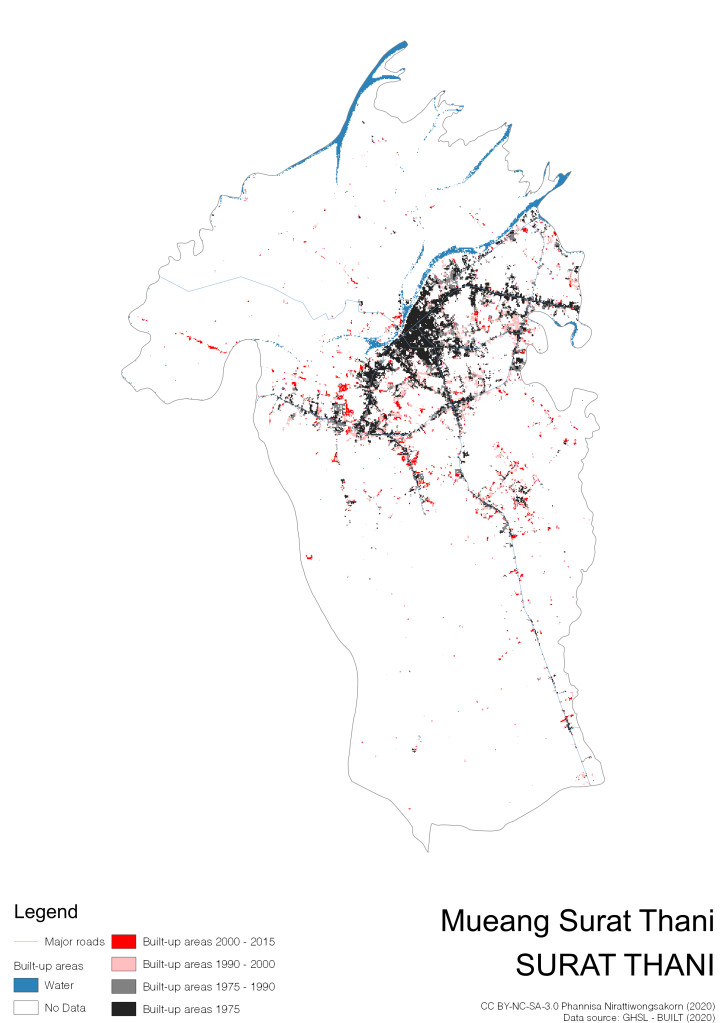
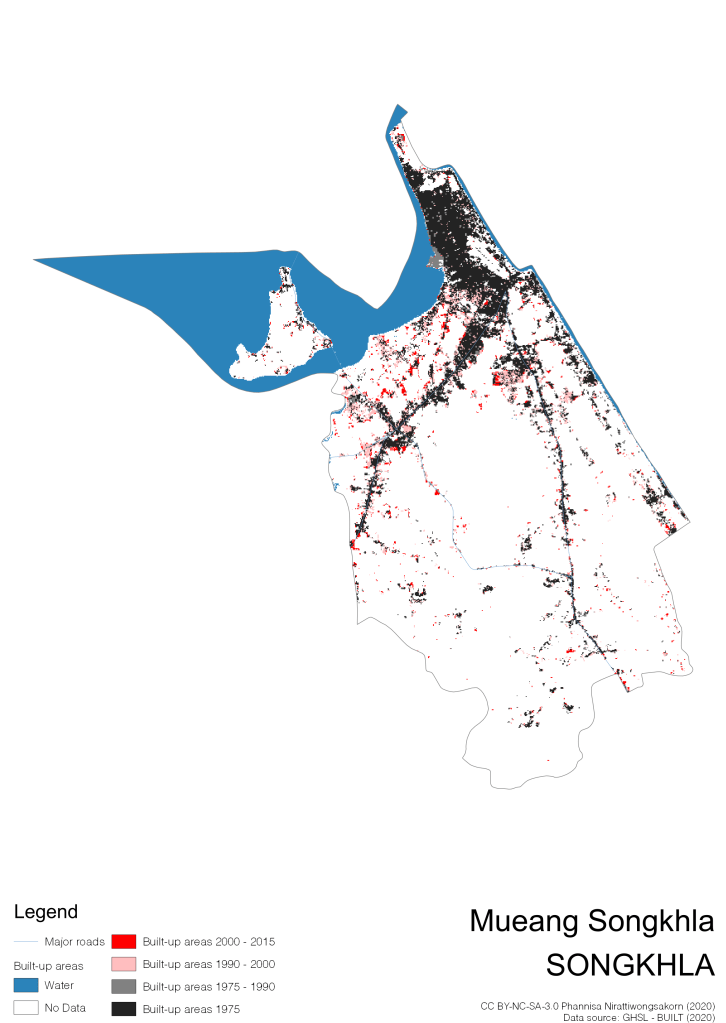
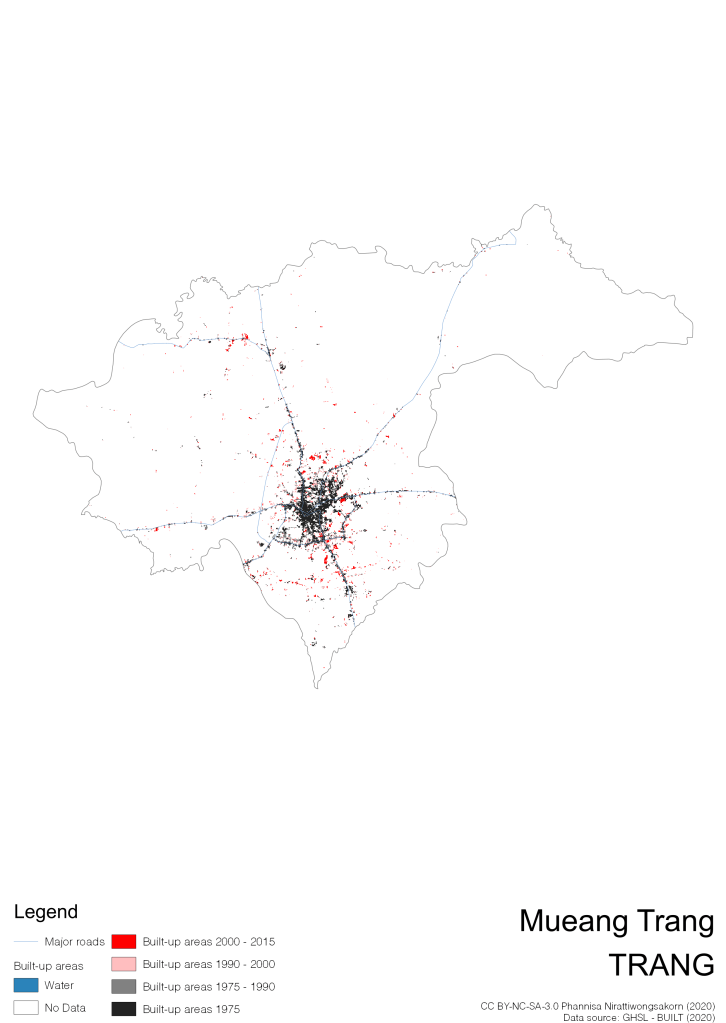
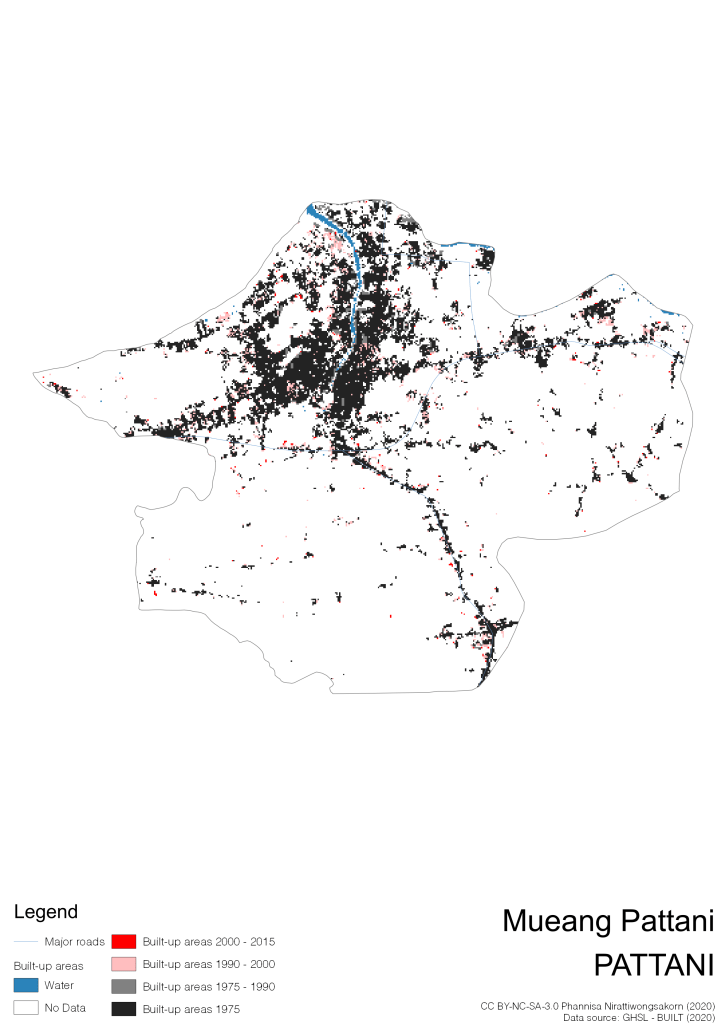
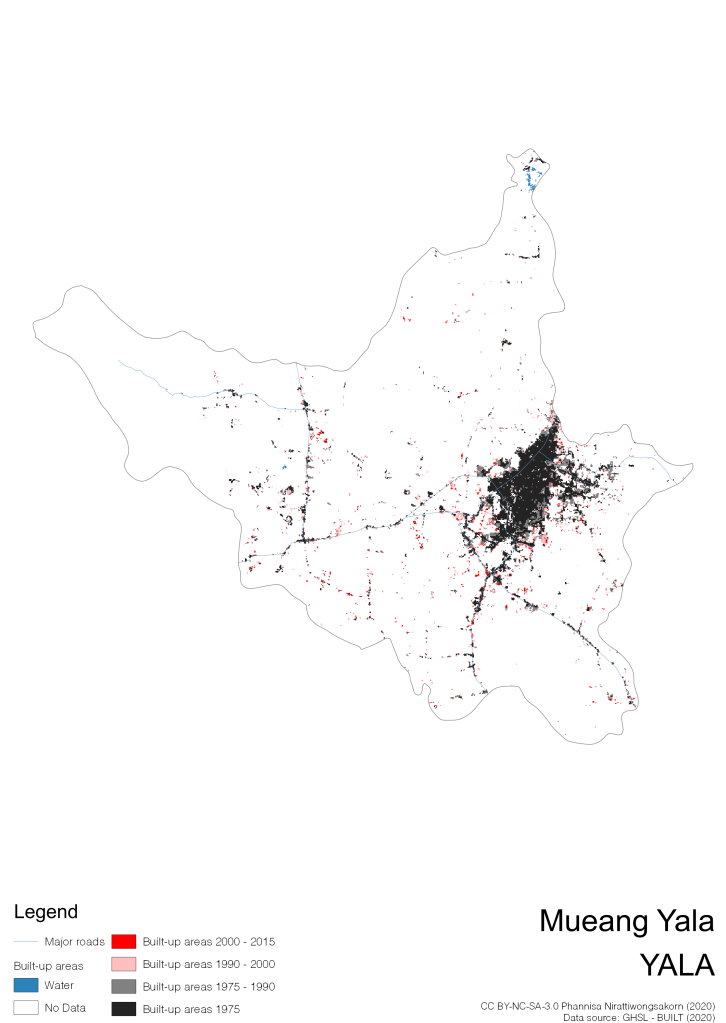
I visualize built-up areas of the 4 periods: until 1975, 1975 – 1990, 1990 – 2000, and 2000 – 2015, by province, and by district (Amphoe). Here you will see different urban patterns of the selected cities.
Legends:
- Black: built-up areas of 1975
- Grey: built-up areas epoch 1975 – 1990
- Pink: built-up areas epoch 191990 – 2000
- Red: built-up areas epoch 2000 – 2015
- Blue: water
- Navy line: major road networks
Data source: European Commission’s Global Human Settlement Layer (GHSL) – BUILT (2020).
Update note: April 2, 2020 – Corrected the name of Bueng Kan Province (from Nong Khai). Thanks to a Twitter fella!
If you are interested in relationship between built-up areas and flooding too, please see new map collection Thailand’s Built-up Areas and Repeating Floods Visualization.
Built-up Areas of 77 Provinces


Built-up Areas of the Selected Cities


Tutorials here.


One thought on “Thailand’s Built-up Areas 1975 – 2015 Visualization”